Immigrants from Mexico vs Peruvian Unemployment Among Women with Children Under 18 years
COMPARE
Immigrants from Mexico
Peruvian
Unemployment Among Women with Children Under 18 years
Unemployment Among Women with Children Under 18 years Comparison
Immigrants from Mexico
Peruvians
6.6%
UNEMPLOYMENT AMONG WOMEN WITH CHILDREN UNDER 18 YEARS
0.0/ 100
METRIC RATING
312th/ 347
METRIC RANK
5.6%
UNEMPLOYMENT AMONG WOMEN WITH CHILDREN UNDER 18 YEARS
12.1/ 100
METRIC RATING
207th/ 347
METRIC RANK
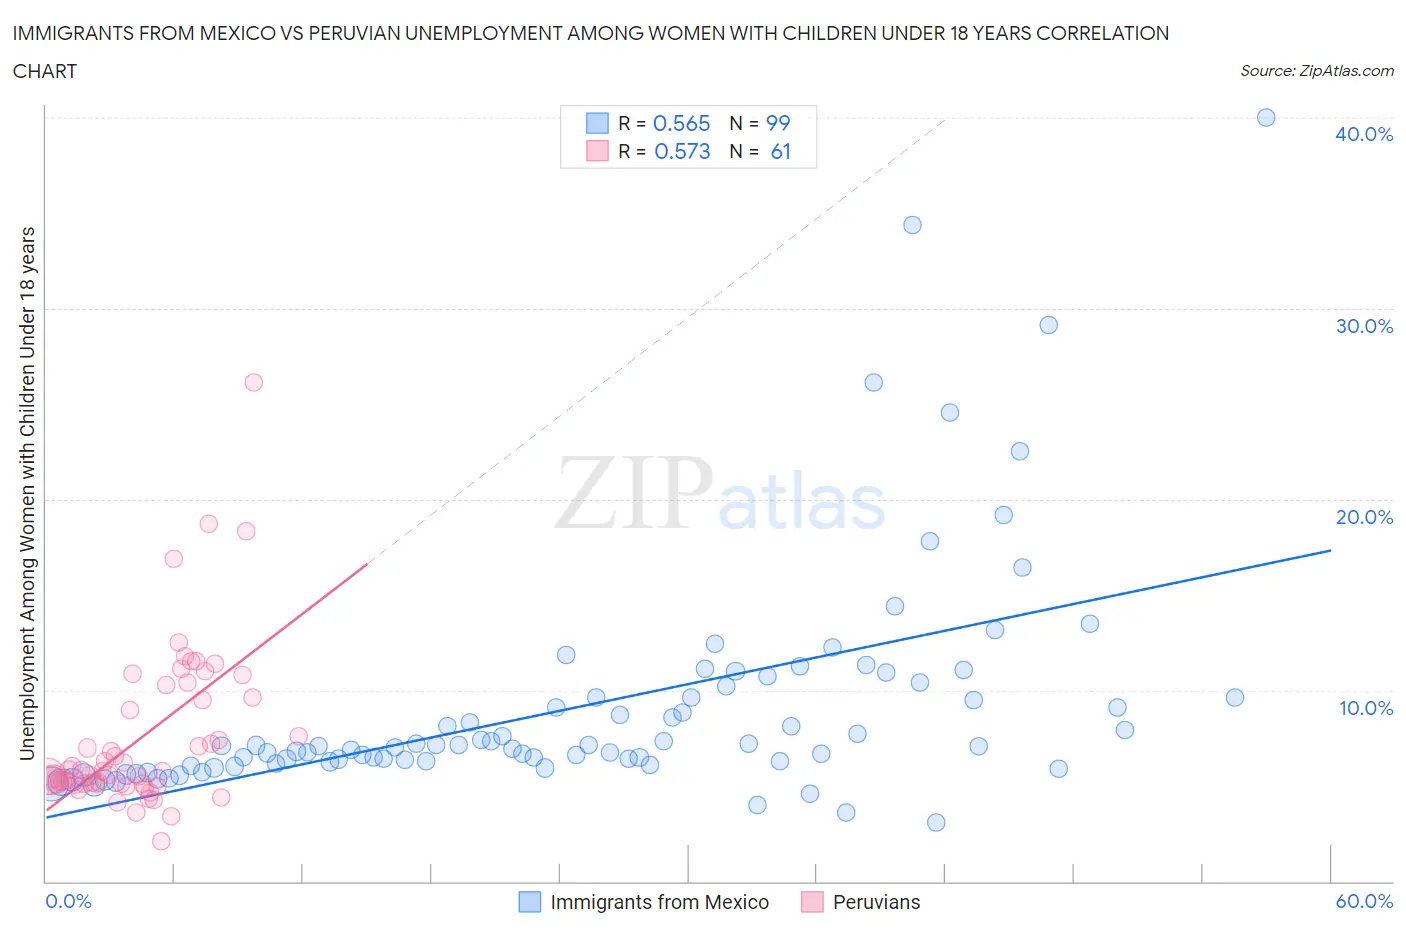
Immigrants from Mexico vs Peruvian Unemployment Among Women with Children Under 18 years Correlation Chart
The statistical analysis conducted on geographies consisting of 478,971,563 people shows a substantial positive correlation between the proportion of Immigrants from Mexico and unemployment rate among women with children under the age of 18 in the United States with a correlation coefficient (R) of 0.565 and weighted average of 6.6%. Similarly, the statistical analysis conducted on geographies consisting of 352,151,471 people shows a substantial positive correlation between the proportion of Peruvians and unemployment rate among women with children under the age of 18 in the United States with a correlation coefficient (R) of 0.573 and weighted average of 5.6%, a difference of 16.8%.
Unemployment Among Women with Children Under 18 years Correlation Summary
| Measurement | Immigrants from Mexico | Peruvian |
| Minimum | 3.1% | 2.1% |
| Maximum | 40.0% | 26.1% |
| Range | 36.9% | 24.0% |
| Mean | 9.2% | 7.6% |
| Median | 7.1% | 5.8% |
| Interquartile 25% (IQ1) | 6.2% | 5.1% |
| Interquartile 75% (IQ3) | 9.6% | 9.9% |
| Interquartile Range (IQR) | 3.4% | 4.8% |
| Standard Deviation (Sample) | 6.1% | 4.3% |
| Standard Deviation (Population) | 6.1% | 4.2% |
Similar Demographics by Unemployment Among Women with Children Under 18 years
Demographics Similar to Immigrants from Mexico by Unemployment Among Women with Children Under 18 years
In terms of unemployment among women with children under 18 years, the demographic groups most similar to Immigrants from Mexico are Yaqui (6.6%, a difference of 0.090%), Hispanic or Latino (6.6%, a difference of 0.29%), Guyanese (6.6%, a difference of 0.39%), British West Indian (6.6%, a difference of 0.43%), and Immigrants from West Indies (6.6%, a difference of 0.43%).
| Demographics | Rating | Rank | Unemployment Among Women with Children Under 18 years |
| Immigrants | Central America | 0.0 /100 | #305 | Tragic 6.5% |
| Immigrants | Guyana | 0.0 /100 | #306 | Tragic 6.5% |
| Belizeans | 0.0 /100 | #307 | Tragic 6.5% |
| Africans | 0.0 /100 | #308 | Tragic 6.5% |
| Ecuadorians | 0.0 /100 | #309 | Tragic 6.5% |
| Guyanese | 0.0 /100 | #310 | Tragic 6.6% |
| Yaqui | 0.0 /100 | #311 | Tragic 6.6% |
| Immigrants | Mexico | 0.0 /100 | #312 | Tragic 6.6% |
| Hispanics or Latinos | 0.0 /100 | #313 | Tragic 6.6% |
| British West Indians | 0.0 /100 | #314 | Tragic 6.6% |
| Immigrants | West Indies | 0.0 /100 | #315 | Tragic 6.6% |
| Immigrants | Ecuador | 0.0 /100 | #316 | Tragic 6.6% |
| Shoshone | 0.0 /100 | #317 | Tragic 6.6% |
| Alaska Natives | 0.0 /100 | #318 | Tragic 6.7% |
| Central American Indians | 0.0 /100 | #319 | Tragic 6.7% |
Demographics Similar to Peruvians by Unemployment Among Women with Children Under 18 years
In terms of unemployment among women with children under 18 years, the demographic groups most similar to Peruvians are Nicaraguan (5.6%, a difference of 0.040%), Immigrants from Costa Rica (5.6%, a difference of 0.080%), Immigrants from Western Asia (5.6%, a difference of 0.13%), Nonimmigrants (5.7%, a difference of 0.24%), and Panamanian (5.7%, a difference of 0.35%).
| Demographics | Rating | Rank | Unemployment Among Women with Children Under 18 years |
| Menominee | 18.6 /100 | #200 | Poor 5.6% |
| Immigrants | Morocco | 17.9 /100 | #201 | Poor 5.6% |
| Immigrants | Micronesia | 17.1 /100 | #202 | Poor 5.6% |
| Portuguese | 15.9 /100 | #203 | Poor 5.6% |
| Israelis | 15.6 /100 | #204 | Poor 5.6% |
| Tsimshian | 15.2 /100 | #205 | Poor 5.6% |
| Nicaraguans | 12.3 /100 | #206 | Poor 5.6% |
| Peruvians | 12.1 /100 | #207 | Poor 5.6% |
| Immigrants | Costa Rica | 11.6 /100 | #208 | Poor 5.6% |
| Immigrants | Western Asia | 11.3 /100 | #209 | Poor 5.6% |
| Immigrants | Nonimmigrants | 10.6 /100 | #210 | Poor 5.7% |
| Panamanians | 10.1 /100 | #211 | Poor 5.7% |
| South Americans | 10.0 /100 | #212 | Poor 5.7% |
| Americans | 8.9 /100 | #213 | Tragic 5.7% |
| Japanese | 8.7 /100 | #214 | Tragic 5.7% |