Guatemalan vs Peruvian Single Mother Poverty
COMPARE
Guatemalan
Peruvian
Single Mother Poverty
Single Mother Poverty Comparison
Guatemalans
Peruvians
32.9%
SINGLE MOTHER POVERTY
0.0/ 100
METRIC RATING
291st/ 347
METRIC RANK
27.5%
SINGLE MOTHER POVERTY
99.2/ 100
METRIC RATING
76th/ 347
METRIC RANK
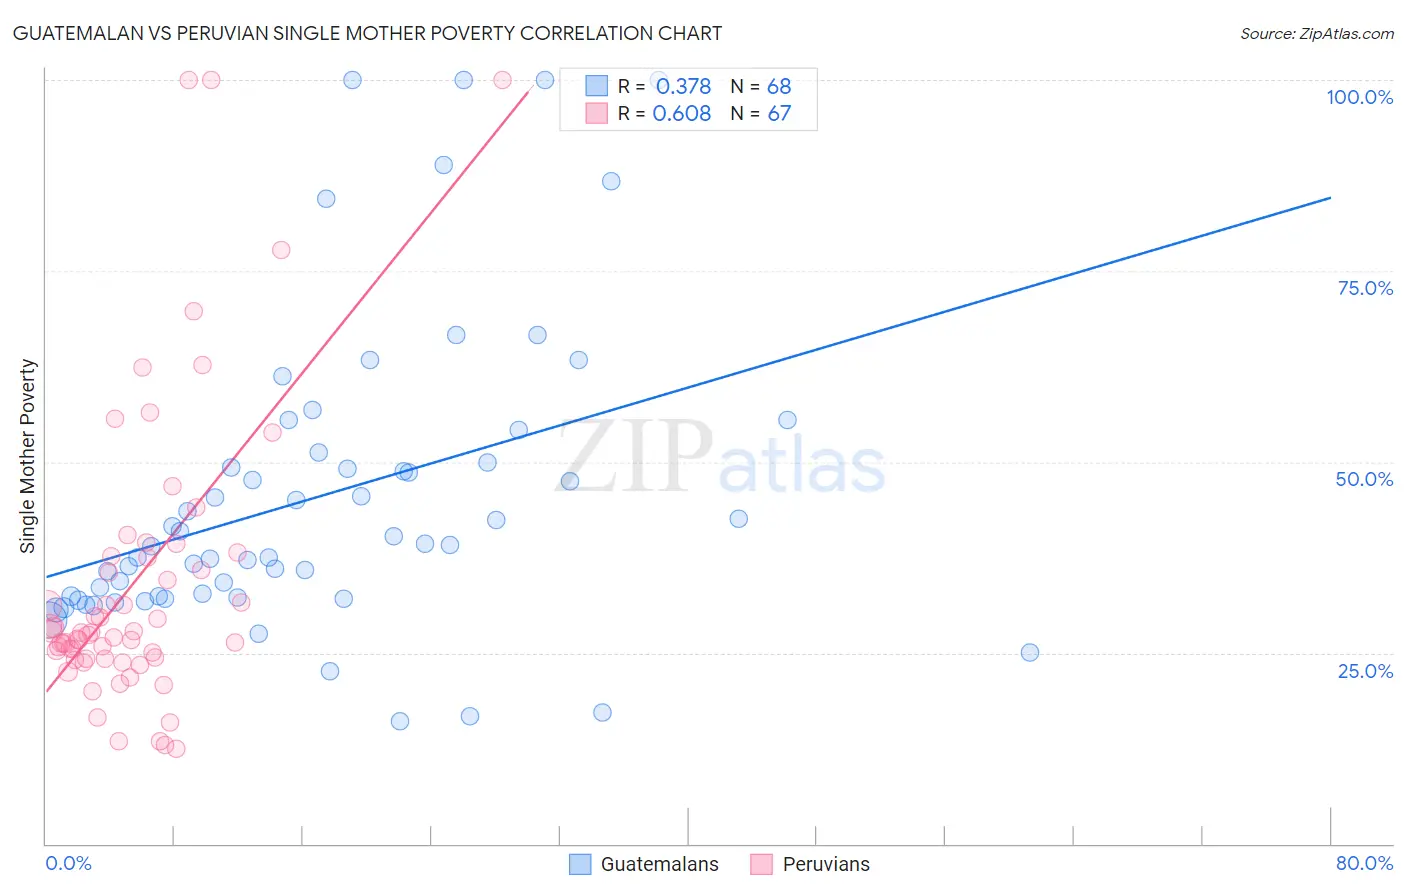
Guatemalan vs Peruvian Single Mother Poverty Correlation Chart
The statistical analysis conducted on geographies consisting of 401,916,262 people shows a mild positive correlation between the proportion of Guatemalans and poverty level among single mothers in the United States with a correlation coefficient (R) of 0.378 and weighted average of 32.9%. Similarly, the statistical analysis conducted on geographies consisting of 355,516,377 people shows a significant positive correlation between the proportion of Peruvians and poverty level among single mothers in the United States with a correlation coefficient (R) of 0.608 and weighted average of 27.5%, a difference of 19.7%.
Single Mother Poverty Correlation Summary
| Measurement | Guatemalan | Peruvian |
| Minimum | 16.0% | 12.4% |
| Maximum | 100.0% | 100.0% |
| Range | 84.0% | 87.6% |
| Mean | 45.6% | 34.3% |
| Median | 39.2% | 27.6% |
| Interquartile 25% (IQ1) | 32.3% | 24.2% |
| Interquartile 75% (IQ3) | 50.6% | 37.7% |
| Interquartile Range (IQR) | 18.3% | 13.4% |
| Standard Deviation (Sample) | 20.1% | 19.4% |
| Standard Deviation (Population) | 19.9% | 19.2% |
Similar Demographics by Single Mother Poverty
Demographics Similar to Guatemalans by Single Mother Poverty
In terms of single mother poverty, the demographic groups most similar to Guatemalans are Shoshone (32.9%, a difference of 0.020%), Aleut (32.9%, a difference of 0.050%), French American Indian (33.1%, a difference of 0.68%), Yaqui (33.1%, a difference of 0.72%), and Blackfeet (33.2%, a difference of 0.88%).
| Demographics | Rating | Rank | Single Mother Poverty |
| Indonesians | 0.0 /100 | #284 | Tragic 32.4% |
| Immigrants | Latin America | 0.0 /100 | #285 | Tragic 32.4% |
| Yup'ik | 0.0 /100 | #286 | Tragic 32.5% |
| Immigrants | Dominica | 0.0 /100 | #287 | Tragic 32.5% |
| Somalis | 0.0 /100 | #288 | Tragic 32.6% |
| U.S. Virgin Islanders | 0.0 /100 | #289 | Tragic 32.6% |
| Osage | 0.0 /100 | #290 | Tragic 32.6% |
| Guatemalans | 0.0 /100 | #291 | Tragic 32.9% |
| Shoshone | 0.0 /100 | #292 | Tragic 32.9% |
| Aleuts | 0.0 /100 | #293 | Tragic 32.9% |
| French American Indians | 0.0 /100 | #294 | Tragic 33.1% |
| Yaqui | 0.0 /100 | #295 | Tragic 33.1% |
| Blackfeet | 0.0 /100 | #296 | Tragic 33.2% |
| Pennsylvania Germans | 0.0 /100 | #297 | Tragic 33.2% |
| Africans | 0.0 /100 | #298 | Tragic 33.3% |
Demographics Similar to Peruvians by Single Mother Poverty
In terms of single mother poverty, the demographic groups most similar to Peruvians are Immigrants from Peru (27.5%, a difference of 0.020%), Immigrants from North Macedonia (27.5%, a difference of 0.030%), Immigrants from Sweden (27.5%, a difference of 0.040%), Immigrants from Italy (27.5%, a difference of 0.070%), and Taiwanese (27.5%, a difference of 0.070%).
| Demographics | Rating | Rank | Single Mother Poverty |
| Lithuanians | 99.4 /100 | #69 | Exceptional 27.4% |
| Immigrants | Belarus | 99.4 /100 | #70 | Exceptional 27.4% |
| Macedonians | 99.4 /100 | #71 | Exceptional 27.4% |
| Immigrants | Russia | 99.4 /100 | #72 | Exceptional 27.4% |
| Sierra Leoneans | 99.3 /100 | #73 | Exceptional 27.4% |
| Immigrants | Europe | 99.3 /100 | #74 | Exceptional 27.4% |
| Immigrants | Sweden | 99.2 /100 | #75 | Exceptional 27.5% |
| Peruvians | 99.2 /100 | #76 | Exceptional 27.5% |
| Immigrants | Peru | 99.2 /100 | #77 | Exceptional 27.5% |
| Immigrants | North Macedonia | 99.2 /100 | #78 | Exceptional 27.5% |
| Immigrants | Italy | 99.1 /100 | #79 | Exceptional 27.5% |
| Taiwanese | 99.1 /100 | #80 | Exceptional 27.5% |
| Immigrants | Scotland | 98.9 /100 | #81 | Exceptional 27.6% |
| Immigrants | Cameroon | 98.8 /100 | #82 | Exceptional 27.6% |
| Greeks | 98.7 /100 | #83 | Exceptional 27.7% |