Immigrants from Argentina vs Cheyenne Female Poverty
COMPARE
Immigrants from Argentina
Cheyenne
Female Poverty
Female Poverty Comparison
Immigrants from Argentina
Cheyenne
12.8%
FEMALE POVERTY
87.0/ 100
METRIC RATING
131st/ 347
METRIC RANK
20.2%
FEMALE POVERTY
0.0/ 100
METRIC RATING
335th/ 347
METRIC RANK
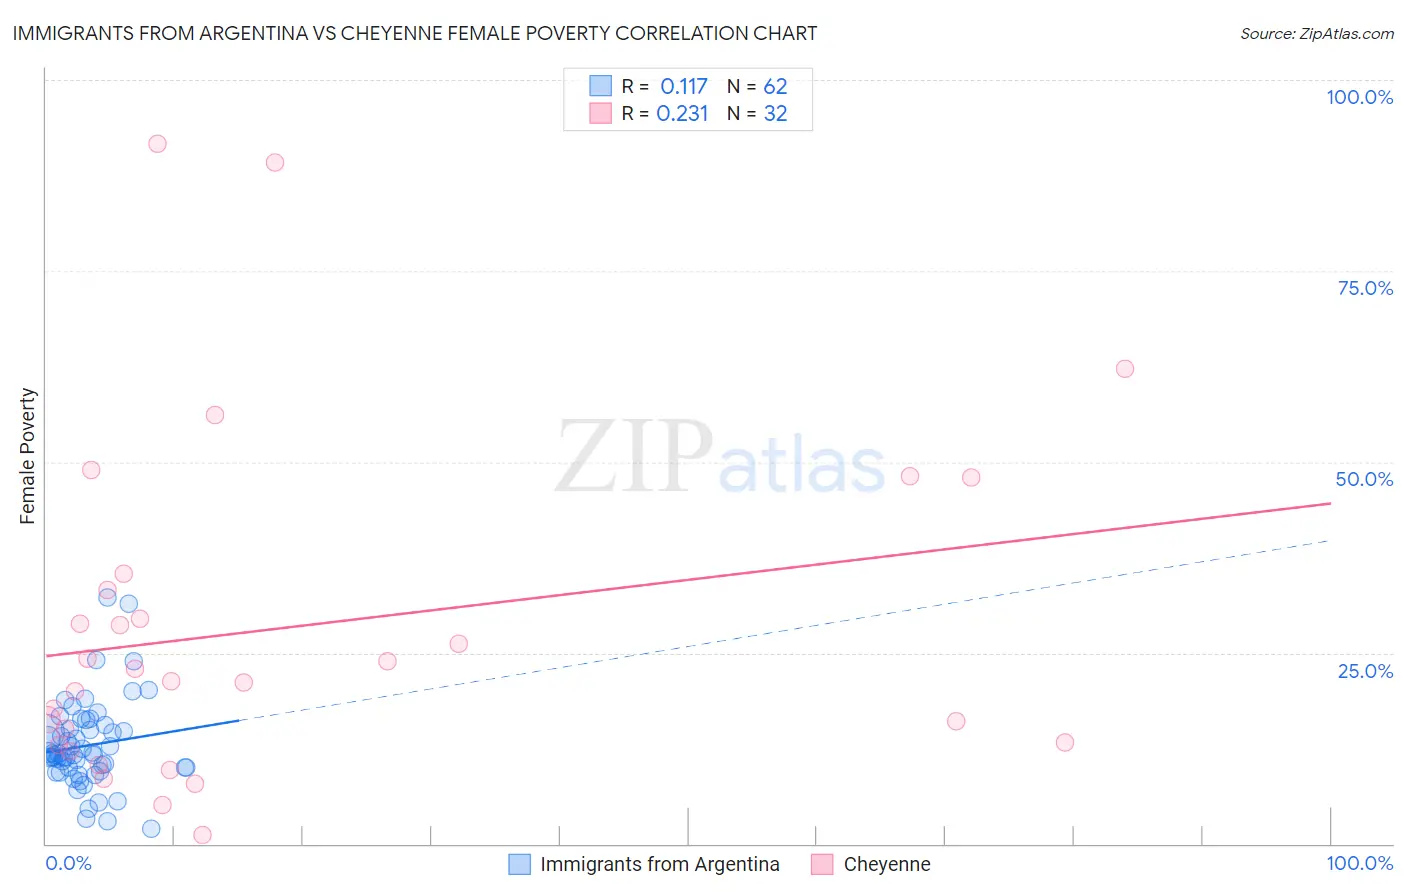
Immigrants from Argentina vs Cheyenne Female Poverty Correlation Chart
The statistical analysis conducted on geographies consisting of 264,332,384 people shows a poor positive correlation between the proportion of Immigrants from Argentina and poverty level among females in the United States with a correlation coefficient (R) of 0.117 and weighted average of 12.8%. Similarly, the statistical analysis conducted on geographies consisting of 80,704,205 people shows a weak positive correlation between the proportion of Cheyenne and poverty level among females in the United States with a correlation coefficient (R) of 0.231 and weighted average of 20.2%, a difference of 57.4%.
Female Poverty Correlation Summary
| Measurement | Immigrants from Argentina | Cheyenne |
| Minimum | 1.9% | 1.1% |
| Maximum | 32.3% | 91.7% |
| Range | 30.4% | 90.6% |
| Mean | 12.9% | 28.3% |
| Median | 11.7% | 22.0% |
| Interquartile 25% (IQ1) | 9.9% | 13.1% |
| Interquartile 75% (IQ3) | 15.0% | 34.3% |
| Interquartile Range (IQR) | 5.0% | 21.2% |
| Standard Deviation (Sample) | 5.7% | 22.2% |
| Standard Deviation (Population) | 5.7% | 21.8% |
Similar Demographics by Female Poverty
Demographics Similar to Immigrants from Argentina by Female Poverty
In terms of female poverty, the demographic groups most similar to Immigrants from Argentina are Immigrants from Jordan (12.8%, a difference of 0.010%), Immigrants from Vietnam (12.8%, a difference of 0.030%), Immigrants from Western Europe (12.8%, a difference of 0.070%), Immigrants from Brazil (12.8%, a difference of 0.22%), and Immigrants from Switzerland (12.9%, a difference of 0.24%).
| Demographics | Rating | Rank | Female Poverty |
| Immigrants | Norway | 89.3 /100 | #124 | Excellent 12.8% |
| Argentineans | 89.1 /100 | #125 | Excellent 12.8% |
| Immigrants | Ukraine | 88.8 /100 | #126 | Excellent 12.8% |
| South Africans | 88.4 /100 | #127 | Excellent 12.8% |
| Immigrants | Belarus | 88.2 /100 | #128 | Excellent 12.8% |
| Immigrants | Brazil | 87.9 /100 | #129 | Excellent 12.8% |
| Immigrants | Vietnam | 87.1 /100 | #130 | Excellent 12.8% |
| Immigrants | Argentina | 87.0 /100 | #131 | Excellent 12.8% |
| Immigrants | Jordan | 86.9 /100 | #132 | Excellent 12.8% |
| Immigrants | Western Europe | 86.6 /100 | #133 | Excellent 12.8% |
| Immigrants | Switzerland | 85.8 /100 | #134 | Excellent 12.9% |
| French | 85.6 /100 | #135 | Excellent 12.9% |
| Peruvians | 85.2 /100 | #136 | Excellent 12.9% |
| Chileans | 84.7 /100 | #137 | Excellent 12.9% |
| Immigrants | France | 83.6 /100 | #138 | Excellent 12.9% |
Demographics Similar to Cheyenne by Female Poverty
In terms of female poverty, the demographic groups most similar to Cheyenne are Houma (20.0%, a difference of 0.77%), Pueblo (20.7%, a difference of 2.4%), Yuman (20.8%, a difference of 3.2%), Sioux (20.9%, a difference of 3.4%), and Hopi (21.0%, a difference of 3.8%).
| Demographics | Rating | Rank | Female Poverty |
| Blacks/African Americans | 0.0 /100 | #328 | Tragic 18.6% |
| Kiowa | 0.0 /100 | #329 | Tragic 18.6% |
| Dominicans | 0.0 /100 | #330 | Tragic 19.1% |
| Natives/Alaskans | 0.0 /100 | #331 | Tragic 19.2% |
| Apache | 0.0 /100 | #332 | Tragic 19.2% |
| Immigrants | Dominican Republic | 0.0 /100 | #333 | Tragic 19.3% |
| Houma | 0.0 /100 | #334 | Tragic 20.0% |
| Cheyenne | 0.0 /100 | #335 | Tragic 20.2% |
| Pueblo | 0.0 /100 | #336 | Tragic 20.7% |
| Yuman | 0.0 /100 | #337 | Tragic 20.8% |
| Sioux | 0.0 /100 | #338 | Tragic 20.9% |
| Hopi | 0.0 /100 | #339 | Tragic 21.0% |
| Yup'ik | 0.0 /100 | #340 | Tragic 21.5% |
| Crow | 0.0 /100 | #341 | Tragic 22.1% |
| Immigrants | Yemen | 0.0 /100 | #342 | Tragic 22.8% |