Immigrants from Egypt vs Dominican Poverty
COMPARE
Immigrants from Egypt
Dominican
Poverty
Poverty Comparison
Immigrants from Egypt
Dominicans
11.5%
POVERTY
94.6/ 100
METRIC RATING
97th/ 347
METRIC RANK
17.6%
POVERTY
0.0/ 100
METRIC RATING
330th/ 347
METRIC RANK
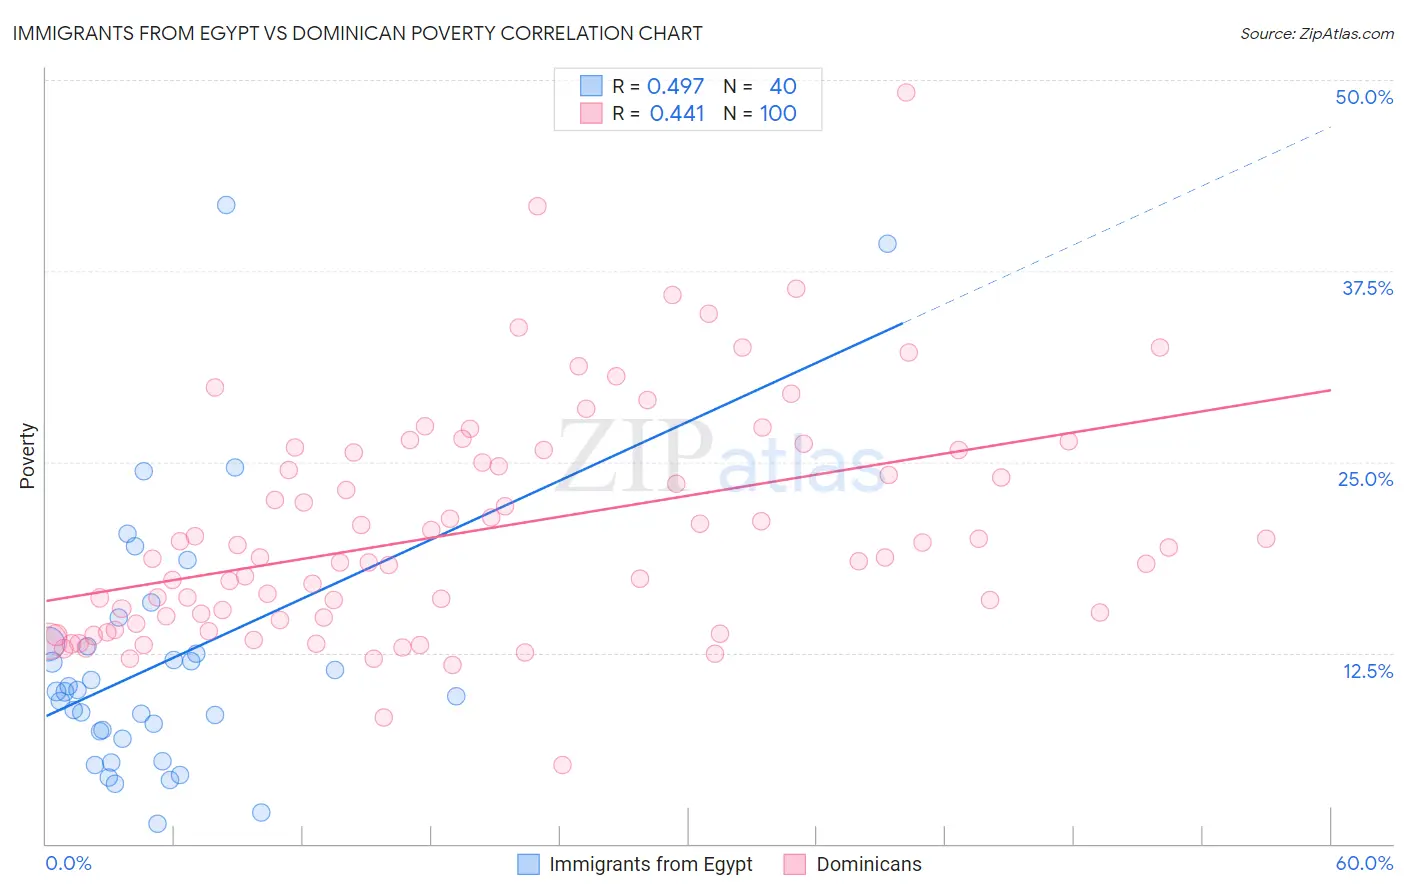
Immigrants from Egypt vs Dominican Poverty Correlation Chart
The statistical analysis conducted on geographies consisting of 245,409,377 people shows a moderate positive correlation between the proportion of Immigrants from Egypt and poverty level in the United States with a correlation coefficient (R) of 0.497 and weighted average of 11.5%. Similarly, the statistical analysis conducted on geographies consisting of 354,775,564 people shows a moderate positive correlation between the proportion of Dominicans and poverty level in the United States with a correlation coefficient (R) of 0.441 and weighted average of 17.6%, a difference of 53.9%.
Poverty Correlation Summary
| Measurement | Immigrants from Egypt | Dominican |
| Minimum | 1.3% | 5.1% |
| Maximum | 41.8% | 49.2% |
| Range | 40.5% | 44.1% |
| Mean | 11.9% | 20.5% |
| Median | 9.9% | 18.7% |
| Interquartile 25% (IQ1) | 7.1% | 14.7% |
| Interquartile 75% (IQ3) | 13.0% | 25.7% |
| Interquartile Range (IQR) | 5.9% | 11.0% |
| Standard Deviation (Sample) | 8.6% | 7.5% |
| Standard Deviation (Population) | 8.5% | 7.5% |
Similar Demographics by Poverty
Demographics Similar to Immigrants from Egypt by Poverty
In terms of poverty, the demographic groups most similar to Immigrants from Egypt are Immigrants from South Africa (11.5%, a difference of 0.030%), Immigrants from Latvia (11.5%, a difference of 0.030%), Australian (11.4%, a difference of 0.15%), Paraguayan (11.4%, a difference of 0.16%), and Immigrants from Indonesia (11.5%, a difference of 0.17%).
| Demographics | Rating | Rank | Poverty |
| Immigrants | Denmark | 95.5 /100 | #90 | Exceptional 11.4% |
| Finns | 95.2 /100 | #91 | Exceptional 11.4% |
| British | 95.0 /100 | #92 | Exceptional 11.4% |
| Romanians | 94.9 /100 | #93 | Exceptional 11.4% |
| Paraguayans | 94.9 /100 | #94 | Exceptional 11.4% |
| Australians | 94.9 /100 | #95 | Exceptional 11.4% |
| Immigrants | South Africa | 94.7 /100 | #96 | Exceptional 11.5% |
| Immigrants | Egypt | 94.6 /100 | #97 | Exceptional 11.5% |
| Immigrants | Latvia | 94.5 /100 | #98 | Exceptional 11.5% |
| Immigrants | Indonesia | 94.2 /100 | #99 | Exceptional 11.5% |
| Scottish | 94.0 /100 | #100 | Exceptional 11.5% |
| Slavs | 93.3 /100 | #101 | Exceptional 11.5% |
| Laotians | 92.4 /100 | #102 | Exceptional 11.6% |
| Okinawans | 92.4 /100 | #103 | Exceptional 11.6% |
| Native Hawaiians | 92.1 /100 | #104 | Exceptional 11.6% |
Demographics Similar to Dominicans by Poverty
In terms of poverty, the demographic groups most similar to Dominicans are Immigrants from Dominican Republic (17.8%, a difference of 0.92%), Black/African American (17.3%, a difference of 2.3%), Native/Alaskan (18.1%, a difference of 2.4%), Ute (16.9%, a difference of 4.3%), and Houma (18.4%, a difference of 4.4%).
| Demographics | Rating | Rank | Poverty |
| Colville | 0.0 /100 | #323 | Tragic 16.6% |
| Yakama | 0.0 /100 | #324 | Tragic 16.7% |
| Central American Indians | 0.0 /100 | #325 | Tragic 16.7% |
| Paiute | 0.0 /100 | #326 | Tragic 16.7% |
| Kiowa | 0.0 /100 | #327 | Tragic 16.8% |
| Ute | 0.0 /100 | #328 | Tragic 16.9% |
| Blacks/African Americans | 0.0 /100 | #329 | Tragic 17.3% |
| Dominicans | 0.0 /100 | #330 | Tragic 17.6% |
| Immigrants | Dominican Republic | 0.0 /100 | #331 | Tragic 17.8% |
| Natives/Alaskans | 0.0 /100 | #332 | Tragic 18.1% |
| Houma | 0.0 /100 | #333 | Tragic 18.4% |
| Apache | 0.0 /100 | #334 | Tragic 18.4% |
| Cheyenne | 0.0 /100 | #335 | Tragic 18.9% |
| Pueblo | 0.0 /100 | #336 | Tragic 19.4% |
| Sioux | 0.0 /100 | #337 | Tragic 19.8% |