Arapaho vs Dominican Poverty
COMPARE
Arapaho
Dominican
Poverty
Poverty Comparison
Arapaho
Dominicans
16.3%
POVERTY
0.0/ 100
METRIC RATING
321st/ 347
METRIC RANK
17.6%
POVERTY
0.0/ 100
METRIC RATING
330th/ 347
METRIC RANK
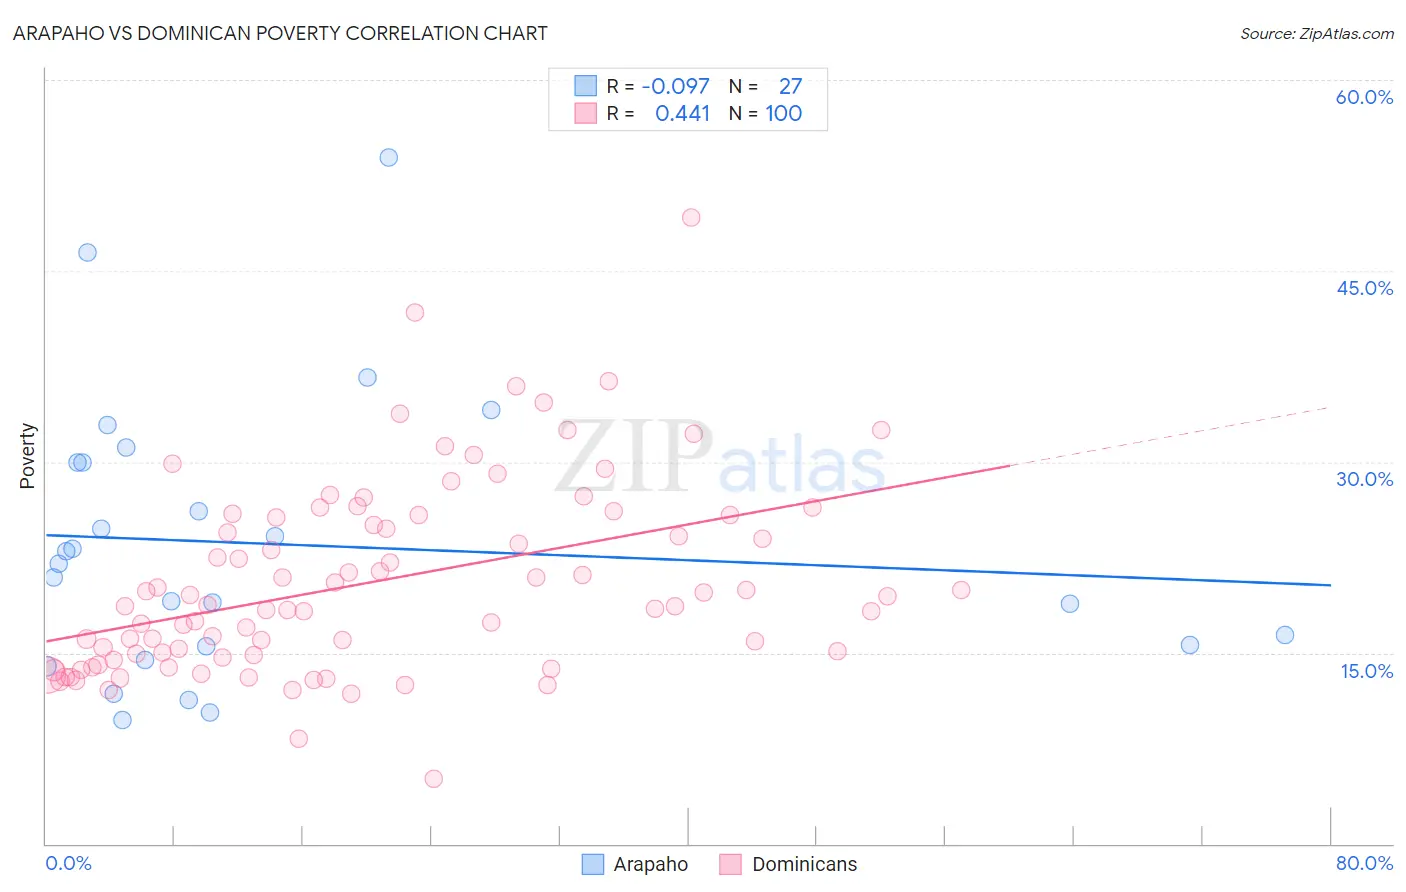
Arapaho vs Dominican Poverty Correlation Chart
The statistical analysis conducted on geographies consisting of 29,778,572 people shows a slight negative correlation between the proportion of Arapaho and poverty level in the United States with a correlation coefficient (R) of -0.097 and weighted average of 16.3%. Similarly, the statistical analysis conducted on geographies consisting of 354,775,564 people shows a moderate positive correlation between the proportion of Dominicans and poverty level in the United States with a correlation coefficient (R) of 0.441 and weighted average of 17.6%, a difference of 8.3%.
Poverty Correlation Summary
| Measurement | Arapaho | Dominican |
| Minimum | 9.8% | 5.1% |
| Maximum | 53.9% | 49.2% |
| Range | 44.2% | 44.1% |
| Mean | 23.5% | 20.5% |
| Median | 22.0% | 18.7% |
| Interquartile 25% (IQ1) | 15.5% | 14.7% |
| Interquartile 75% (IQ3) | 30.0% | 25.7% |
| Interquartile Range (IQR) | 14.4% | 11.0% |
| Standard Deviation (Sample) | 10.8% | 7.5% |
| Standard Deviation (Population) | 10.6% | 7.5% |
Demographics Similar to Arapaho and Dominicans by Poverty
In terms of poverty, the demographic groups most similar to Arapaho are Immigrants from Honduras (16.2%, a difference of 0.74%), Menominee (16.4%, a difference of 0.96%), Immigrants from Congo (16.1%, a difference of 0.97%), Immigrants from Dominica (16.1%, a difference of 1.2%), and U.S. Virgin Islander (16.1%, a difference of 1.5%). Similarly, the demographic groups most similar to Dominicans are Immigrants from Dominican Republic (17.8%, a difference of 0.92%), Black/African American (17.3%, a difference of 2.3%), Native/Alaskan (18.1%, a difference of 2.4%), Ute (16.9%, a difference of 4.3%), and Houma (18.4%, a difference of 4.4%).
| Demographics | Rating | Rank | Poverty |
| British West Indians | 0.0 /100 | #315 | Tragic 15.9% |
| Hondurans | 0.0 /100 | #316 | Tragic 15.9% |
| U.S. Virgin Islanders | 0.0 /100 | #317 | Tragic 16.1% |
| Immigrants | Dominica | 0.0 /100 | #318 | Tragic 16.1% |
| Immigrants | Congo | 0.0 /100 | #319 | Tragic 16.1% |
| Immigrants | Honduras | 0.0 /100 | #320 | Tragic 16.2% |
| Arapaho | 0.0 /100 | #321 | Tragic 16.3% |
| Menominee | 0.0 /100 | #322 | Tragic 16.4% |
| Colville | 0.0 /100 | #323 | Tragic 16.6% |
| Yakama | 0.0 /100 | #324 | Tragic 16.7% |
| Central American Indians | 0.0 /100 | #325 | Tragic 16.7% |
| Paiute | 0.0 /100 | #326 | Tragic 16.7% |
| Kiowa | 0.0 /100 | #327 | Tragic 16.8% |
| Ute | 0.0 /100 | #328 | Tragic 16.9% |
| Blacks/African Americans | 0.0 /100 | #329 | Tragic 17.3% |
| Dominicans | 0.0 /100 | #330 | Tragic 17.6% |
| Immigrants | Dominican Republic | 0.0 /100 | #331 | Tragic 17.8% |
| Natives/Alaskans | 0.0 /100 | #332 | Tragic 18.1% |
| Houma | 0.0 /100 | #333 | Tragic 18.4% |
| Apache | 0.0 /100 | #334 | Tragic 18.4% |
| Cheyenne | 0.0 /100 | #335 | Tragic 18.9% |