Immigrants from Latin America vs Paiute Unemployment Among Women with Children Ages 6 to 17 years
COMPARE
Immigrants from Latin America
Paiute
Unemployment Among Women with Children Ages 6 to 17 years
Unemployment Among Women with Children Ages 6 to 17 years Comparison
Immigrants from Latin America
Paiute
9.6%
UNEMPLOYMENT AMONG WOMEN WITH CHILDREN AGES 6 TO 17 YEARS
0.1/ 100
METRIC RATING
271st/ 347
METRIC RANK
8.5%
UNEMPLOYMENT AMONG WOMEN WITH CHILDREN AGES 6 TO 17 YEARS
99.1/ 100
METRIC RATING
89th/ 347
METRIC RANK
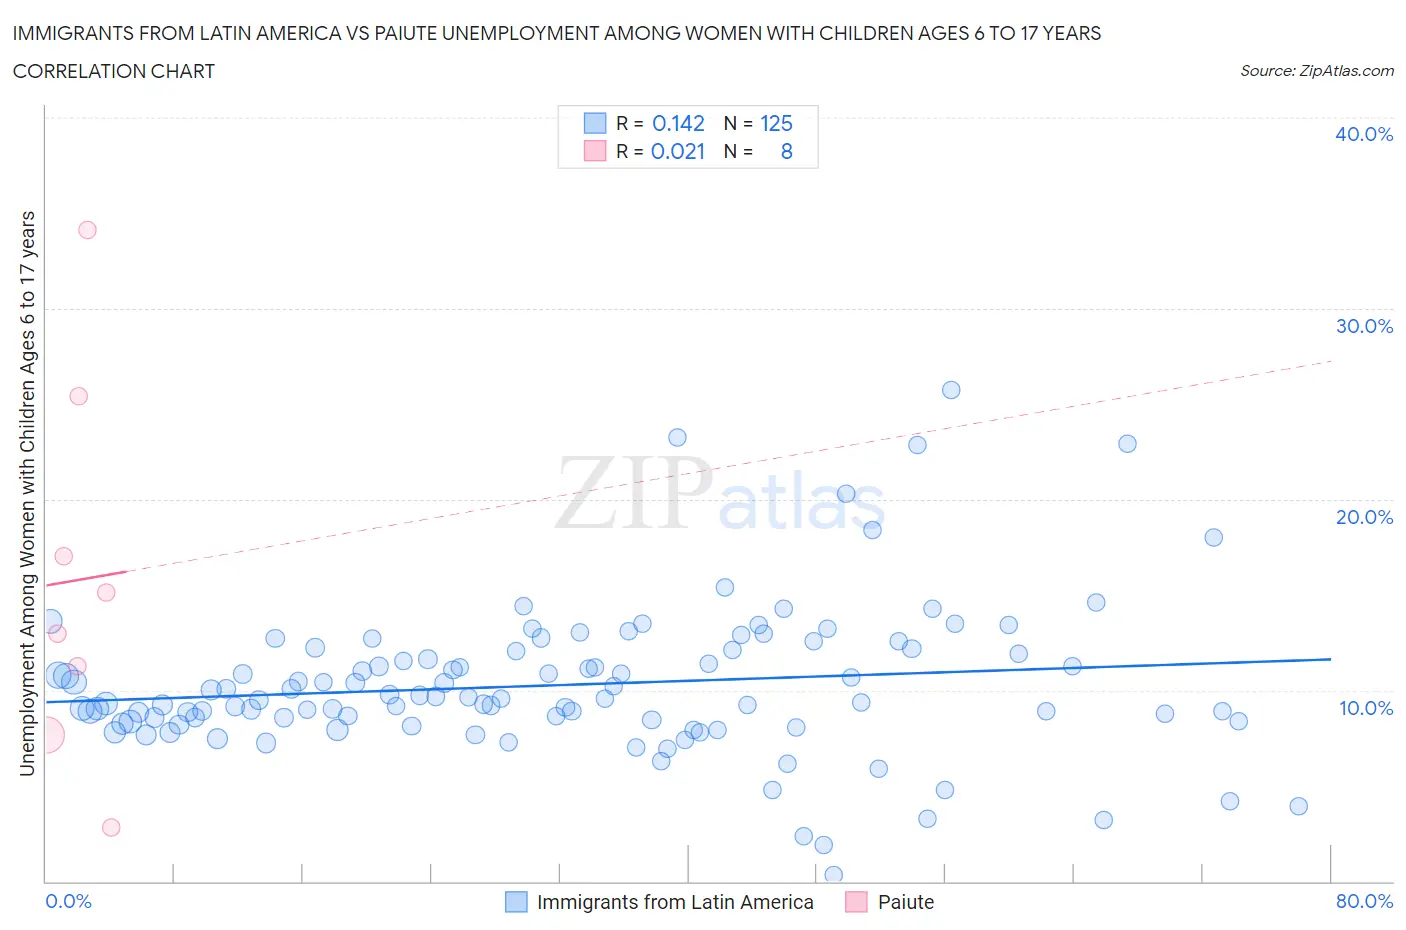
Immigrants from Latin America vs Paiute Unemployment Among Women with Children Ages 6 to 17 years Correlation Chart
The statistical analysis conducted on geographies consisting of 357,703,345 people shows a poor positive correlation between the proportion of Immigrants from Latin America and unemployment rate among women with children between the ages 6 and 17 in the United States with a correlation coefficient (R) of 0.142 and weighted average of 9.6%. Similarly, the statistical analysis conducted on geographies consisting of 53,618,284 people shows no correlation between the proportion of Paiute and unemployment rate among women with children between the ages 6 and 17 in the United States with a correlation coefficient (R) of 0.021 and weighted average of 8.5%, a difference of 13.3%.
Unemployment Among Women with Children Ages 6 to 17 years Correlation Summary
| Measurement | Immigrants from Latin America | Paiute |
| Minimum | 0.30% | 2.8% |
| Maximum | 25.7% | 34.1% |
| Range | 25.4% | 31.3% |
| Mean | 10.3% | 15.8% |
| Median | 9.6% | 14.0% |
| Interquartile 25% (IQ1) | 8.4% | 9.4% |
| Interquartile 75% (IQ3) | 12.1% | 21.2% |
| Interquartile Range (IQR) | 3.7% | 11.8% |
| Standard Deviation (Sample) | 3.9% | 10.0% |
| Standard Deviation (Population) | 3.9% | 9.3% |
Similar Demographics by Unemployment Among Women with Children Ages 6 to 17 years
Demographics Similar to Immigrants from Latin America by Unemployment Among Women with Children Ages 6 to 17 years
In terms of unemployment among women with children ages 6 to 17 years, the demographic groups most similar to Immigrants from Latin America are Kiowa (9.6%, a difference of 0.060%), White/Caucasian (9.6%, a difference of 0.070%), Aleut (9.6%, a difference of 0.12%), Immigrants from Nicaragua (9.6%, a difference of 0.40%), and Blackfeet (9.6%, a difference of 0.50%).
| Demographics | Rating | Rank | Unemployment Among Women with Children Ages 6 to 17 years |
| Immigrants | Ghana | 0.4 /100 | #264 | Tragic 9.5% |
| West Indians | 0.4 /100 | #265 | Tragic 9.5% |
| Immigrants | Jamaica | 0.3 /100 | #266 | Tragic 9.5% |
| Irish | 0.3 /100 | #267 | Tragic 9.5% |
| Ghanaians | 0.2 /100 | #268 | Tragic 9.6% |
| Blackfeet | 0.2 /100 | #269 | Tragic 9.6% |
| Immigrants | Nicaragua | 0.2 /100 | #270 | Tragic 9.6% |
| Immigrants | Latin America | 0.1 /100 | #271 | Tragic 9.6% |
| Kiowa | 0.1 /100 | #272 | Tragic 9.6% |
| Whites/Caucasians | 0.1 /100 | #273 | Tragic 9.6% |
| Aleuts | 0.1 /100 | #274 | Tragic 9.6% |
| U.S. Virgin Islanders | 0.1 /100 | #275 | Tragic 9.7% |
| Immigrants | Portugal | 0.1 /100 | #276 | Tragic 9.7% |
| British West Indians | 0.1 /100 | #277 | Tragic 9.7% |
| French | 0.1 /100 | #278 | Tragic 9.7% |
Demographics Similar to Paiute by Unemployment Among Women with Children Ages 6 to 17 years
In terms of unemployment among women with children ages 6 to 17 years, the demographic groups most similar to Paiute are Yugoslavian (8.5%, a difference of 0.040%), Immigrants from Vietnam (8.5%, a difference of 0.080%), Immigrants from Israel (8.5%, a difference of 0.10%), Immigrants from Eastern Europe (8.5%, a difference of 0.10%), and Potawatomi (8.5%, a difference of 0.13%).
| Demographics | Rating | Rank | Unemployment Among Women with Children Ages 6 to 17 years |
| Cypriots | 99.6 /100 | #82 | Exceptional 8.4% |
| Bulgarians | 99.5 /100 | #83 | Exceptional 8.4% |
| Japanese | 99.5 /100 | #84 | Exceptional 8.4% |
| Immigrants | North Macedonia | 99.4 /100 | #85 | Exceptional 8.5% |
| Alaskan Athabascans | 99.4 /100 | #86 | Exceptional 8.5% |
| Immigrants | Israel | 99.1 /100 | #87 | Exceptional 8.5% |
| Immigrants | Vietnam | 99.1 /100 | #88 | Exceptional 8.5% |
| Paiute | 99.1 /100 | #89 | Exceptional 8.5% |
| Yugoslavians | 99.0 /100 | #90 | Exceptional 8.5% |
| Immigrants | Eastern Europe | 99.0 /100 | #91 | Exceptional 8.5% |
| Potawatomi | 99.0 /100 | #92 | Exceptional 8.5% |
| Australians | 98.9 /100 | #93 | Exceptional 8.5% |
| Immigrants | Barbados | 98.8 /100 | #94 | Exceptional 8.5% |
| Sri Lankans | 98.7 /100 | #95 | Exceptional 8.5% |
| German Russians | 98.6 /100 | #96 | Exceptional 8.5% |