Potawatomi vs Immigrants from Western Asia Poverty
COMPARE
Potawatomi
Immigrants from Western Asia
Poverty
Poverty Comparison
Potawatomi
Immigrants from Western Asia
14.1%
POVERTY
0.3/ 100
METRIC RATING
246th/ 347
METRIC RANK
12.9%
POVERTY
14.1/ 100
METRIC RATING
204th/ 347
METRIC RANK
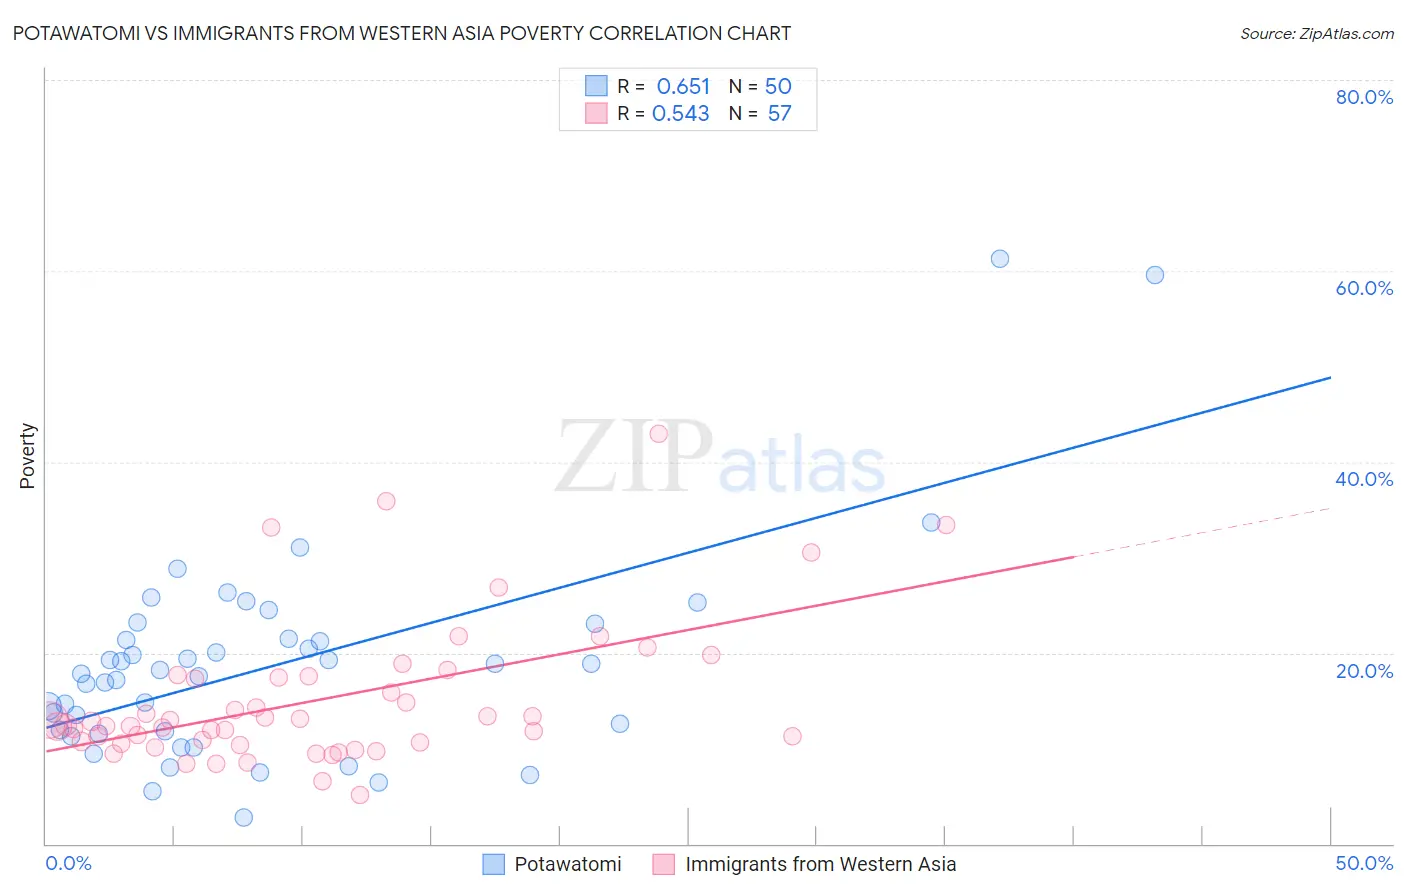
Potawatomi vs Immigrants from Western Asia Poverty Correlation Chart
The statistical analysis conducted on geographies consisting of 117,756,433 people shows a significant positive correlation between the proportion of Potawatomi and poverty level in the United States with a correlation coefficient (R) of 0.651 and weighted average of 14.1%. Similarly, the statistical analysis conducted on geographies consisting of 404,214,361 people shows a substantial positive correlation between the proportion of Immigrants from Western Asia and poverty level in the United States with a correlation coefficient (R) of 0.543 and weighted average of 12.9%, a difference of 9.7%.
Poverty Correlation Summary
| Measurement | Potawatomi | Immigrants from Western Asia |
| Minimum | 2.7% | 5.2% |
| Maximum | 61.3% | 42.9% |
| Range | 58.6% | 37.7% |
| Mean | 18.7% | 15.1% |
| Median | 18.0% | 12.5% |
| Interquartile 25% (IQ1) | 11.8% | 10.5% |
| Interquartile 75% (IQ3) | 21.5% | 17.5% |
| Interquartile Range (IQR) | 9.7% | 7.0% |
| Standard Deviation (Sample) | 11.0% | 7.6% |
| Standard Deviation (Population) | 10.9% | 7.5% |
Similar Demographics by Poverty
Demographics Similar to Potawatomi by Poverty
In terms of poverty, the demographic groups most similar to Potawatomi are Immigrants from Sudan (14.1%, a difference of 0.20%), Liberian (14.1%, a difference of 0.28%), Immigrants from Western Africa (14.1%, a difference of 0.30%), Immigrants from Ghana (14.2%, a difference of 0.40%), and Nepalese (14.0%, a difference of 0.59%).
| Demographics | Rating | Rank | Poverty |
| Nicaraguans | 0.4 /100 | #239 | Tragic 13.9% |
| Immigrants | Middle Africa | 0.4 /100 | #240 | Tragic 14.0% |
| Salvadorans | 0.4 /100 | #241 | Tragic 14.0% |
| Ecuadorians | 0.4 /100 | #242 | Tragic 14.0% |
| Sudanese | 0.3 /100 | #243 | Tragic 14.0% |
| Nepalese | 0.3 /100 | #244 | Tragic 14.0% |
| Immigrants | Sudan | 0.3 /100 | #245 | Tragic 14.1% |
| Potawatomi | 0.3 /100 | #246 | Tragic 14.1% |
| Liberians | 0.2 /100 | #247 | Tragic 14.1% |
| Immigrants | Western Africa | 0.2 /100 | #248 | Tragic 14.1% |
| Immigrants | Ghana | 0.2 /100 | #249 | Tragic 14.2% |
| Cree | 0.2 /100 | #250 | Tragic 14.2% |
| Immigrants | Burma/Myanmar | 0.2 /100 | #251 | Tragic 14.2% |
| Spanish American Indians | 0.2 /100 | #252 | Tragic 14.2% |
| Immigrants | Trinidad and Tobago | 0.2 /100 | #253 | Tragic 14.2% |
Demographics Similar to Immigrants from Western Asia by Poverty
In terms of poverty, the demographic groups most similar to Immigrants from Western Asia are Hmong (12.8%, a difference of 0.16%), Immigrants from Uruguay (12.8%, a difference of 0.26%), Spaniard (12.8%, a difference of 0.43%), Immigrants from Uganda (12.8%, a difference of 0.43%), and Immigrants from Kenya (12.8%, a difference of 0.59%).
| Demographics | Rating | Rank | Poverty |
| Immigrants | Lebanon | 18.7 /100 | #197 | Poor 12.8% |
| Spanish | 18.7 /100 | #198 | Poor 12.8% |
| Immigrants | Kenya | 17.5 /100 | #199 | Poor 12.8% |
| Spaniards | 16.5 /100 | #200 | Poor 12.8% |
| Immigrants | Uganda | 16.5 /100 | #201 | Poor 12.8% |
| Immigrants | Uruguay | 15.6 /100 | #202 | Poor 12.8% |
| Hmong | 15.0 /100 | #203 | Poor 12.8% |
| Immigrants | Western Asia | 14.1 /100 | #204 | Poor 12.9% |
| Tsimshian | 9.2 /100 | #205 | Tragic 13.0% |
| Immigrants | Eastern Africa | 7.0 /100 | #206 | Tragic 13.1% |
| Panamanians | 6.6 /100 | #207 | Tragic 13.1% |
| Ugandans | 6.2 /100 | #208 | Tragic 13.1% |
| Malaysians | 6.1 /100 | #209 | Tragic 13.1% |
| Immigrants | Azores | 6.1 /100 | #210 | Tragic 13.1% |
| Moroccans | 5.2 /100 | #211 | Tragic 13.2% |