Nigerian vs Immigrants from Western Asia Poverty
COMPARE
Nigerian
Immigrants from Western Asia
Poverty
Poverty Comparison
Nigerians
Immigrants from Western Asia
13.6%
POVERTY
1.4/ 100
METRIC RATING
231st/ 347
METRIC RANK
12.9%
POVERTY
14.1/ 100
METRIC RATING
204th/ 347
METRIC RANK
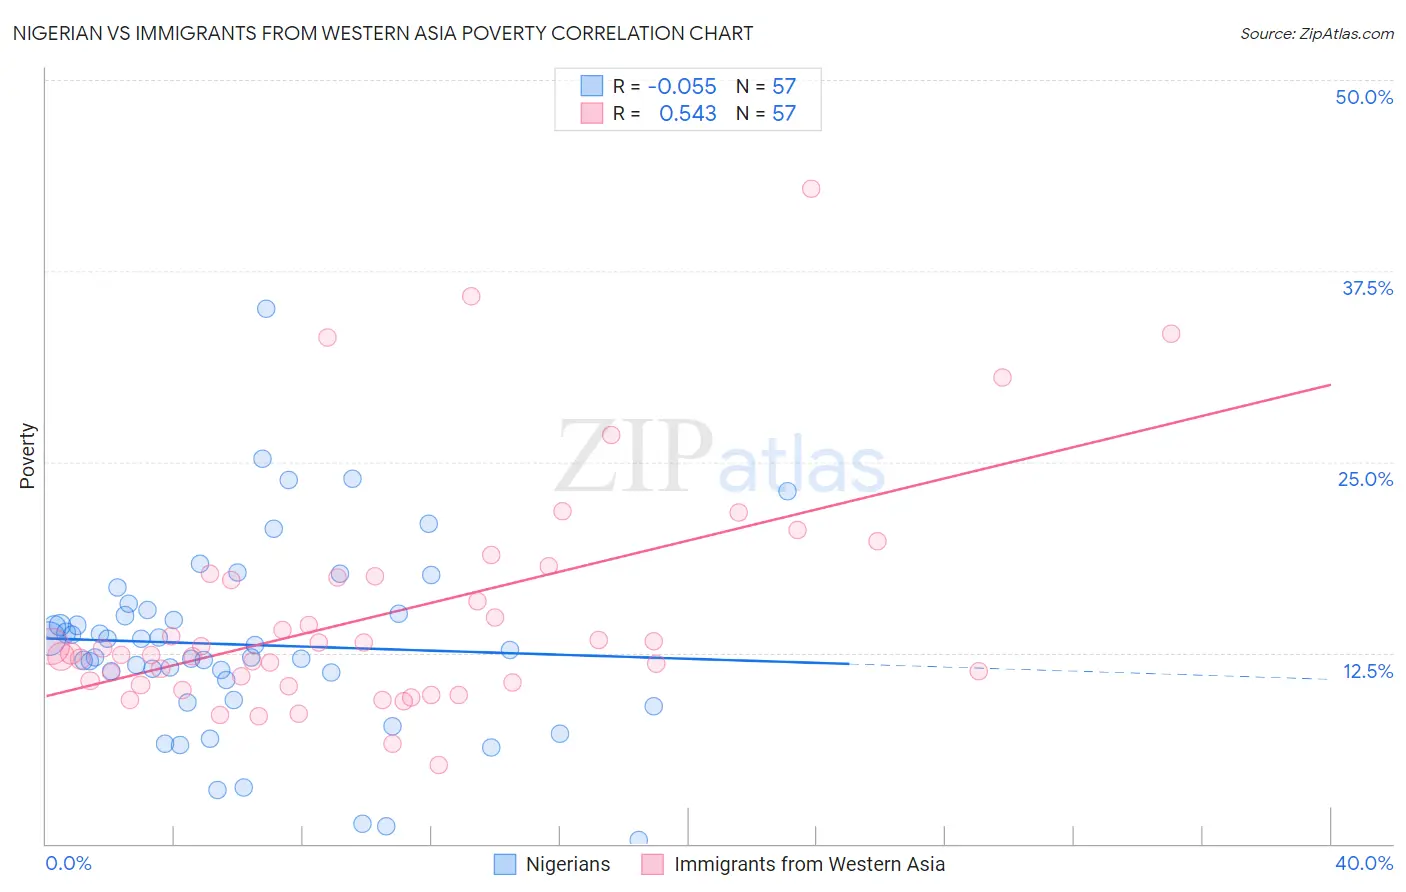
Nigerian vs Immigrants from Western Asia Poverty Correlation Chart
The statistical analysis conducted on geographies consisting of 332,501,950 people shows a slight negative correlation between the proportion of Nigerians and poverty level in the United States with a correlation coefficient (R) of -0.055 and weighted average of 13.6%. Similarly, the statistical analysis conducted on geographies consisting of 404,214,361 people shows a substantial positive correlation between the proportion of Immigrants from Western Asia and poverty level in the United States with a correlation coefficient (R) of 0.543 and weighted average of 12.9%, a difference of 5.7%.
Poverty Correlation Summary
| Measurement | Nigerian | Immigrants from Western Asia |
| Minimum | 0.27% | 5.2% |
| Maximum | 35.0% | 42.9% |
| Range | 34.7% | 37.7% |
| Mean | 13.0% | 15.1% |
| Median | 12.6% | 12.5% |
| Interquartile 25% (IQ1) | 10.1% | 10.5% |
| Interquartile 75% (IQ3) | 15.2% | 17.5% |
| Interquartile Range (IQR) | 5.1% | 7.0% |
| Standard Deviation (Sample) | 6.2% | 7.6% |
| Standard Deviation (Population) | 6.1% | 7.5% |
Similar Demographics by Poverty
Demographics Similar to Nigerians by Poverty
In terms of poverty, the demographic groups most similar to Nigerians are Alaskan Athabascan (13.6%, a difference of 0.17%), Osage (13.6%, a difference of 0.22%), Immigrants from Nigeria (13.5%, a difference of 0.46%), Alaska Native (13.5%, a difference of 0.92%), and Marshallese (13.4%, a difference of 1.1%).
| Demographics | Rating | Rank | Poverty |
| Immigrants | Eritrea | 2.4 /100 | #224 | Tragic 13.4% |
| German Russians | 2.2 /100 | #225 | Tragic 13.4% |
| Marshallese | 2.2 /100 | #226 | Tragic 13.4% |
| Alaska Natives | 2.1 /100 | #227 | Tragic 13.5% |
| Immigrants | Nigeria | 1.7 /100 | #228 | Tragic 13.5% |
| Osage | 1.5 /100 | #229 | Tragic 13.6% |
| Alaskan Athabascans | 1.5 /100 | #230 | Tragic 13.6% |
| Nigerians | 1.4 /100 | #231 | Tragic 13.6% |
| Fijians | 0.8 /100 | #232 | Tragic 13.7% |
| Immigrants | Saudi Arabia | 0.8 /100 | #233 | Tragic 13.8% |
| Immigrants | Laos | 0.7 /100 | #234 | Tragic 13.8% |
| Cubans | 0.6 /100 | #235 | Tragic 13.9% |
| Immigrants | Armenia | 0.5 /100 | #236 | Tragic 13.9% |
| French American Indians | 0.5 /100 | #237 | Tragic 13.9% |
| Ghanaians | 0.5 /100 | #238 | Tragic 13.9% |
Demographics Similar to Immigrants from Western Asia by Poverty
In terms of poverty, the demographic groups most similar to Immigrants from Western Asia are Hmong (12.8%, a difference of 0.16%), Immigrants from Uruguay (12.8%, a difference of 0.26%), Spaniard (12.8%, a difference of 0.43%), Immigrants from Uganda (12.8%, a difference of 0.43%), and Immigrants from Kenya (12.8%, a difference of 0.59%).
| Demographics | Rating | Rank | Poverty |
| Immigrants | Lebanon | 18.7 /100 | #197 | Poor 12.8% |
| Spanish | 18.7 /100 | #198 | Poor 12.8% |
| Immigrants | Kenya | 17.5 /100 | #199 | Poor 12.8% |
| Spaniards | 16.5 /100 | #200 | Poor 12.8% |
| Immigrants | Uganda | 16.5 /100 | #201 | Poor 12.8% |
| Immigrants | Uruguay | 15.6 /100 | #202 | Poor 12.8% |
| Hmong | 15.0 /100 | #203 | Poor 12.8% |
| Immigrants | Western Asia | 14.1 /100 | #204 | Poor 12.9% |
| Tsimshian | 9.2 /100 | #205 | Tragic 13.0% |
| Immigrants | Eastern Africa | 7.0 /100 | #206 | Tragic 13.1% |
| Panamanians | 6.6 /100 | #207 | Tragic 13.1% |
| Ugandans | 6.2 /100 | #208 | Tragic 13.1% |
| Malaysians | 6.1 /100 | #209 | Tragic 13.1% |
| Immigrants | Azores | 6.1 /100 | #210 | Tragic 13.1% |
| Moroccans | 5.2 /100 | #211 | Tragic 13.2% |