Asian vs Hopi Child Poverty Among Girls Under 16
COMPARE
Asian
Hopi
Child Poverty Among Girls Under 16
Child Poverty Among Girls Under 16 Comparison
Asians
Hopi
13.7%
CHILD POVERTY AMONG GIRLS UNDER 16
99.7/ 100
METRIC RATING
30th/ 347
METRIC RANK
27.9%
CHILD POVERTY AMONG GIRLS UNDER 16
0.0/ 100
METRIC RATING
341st/ 347
METRIC RANK
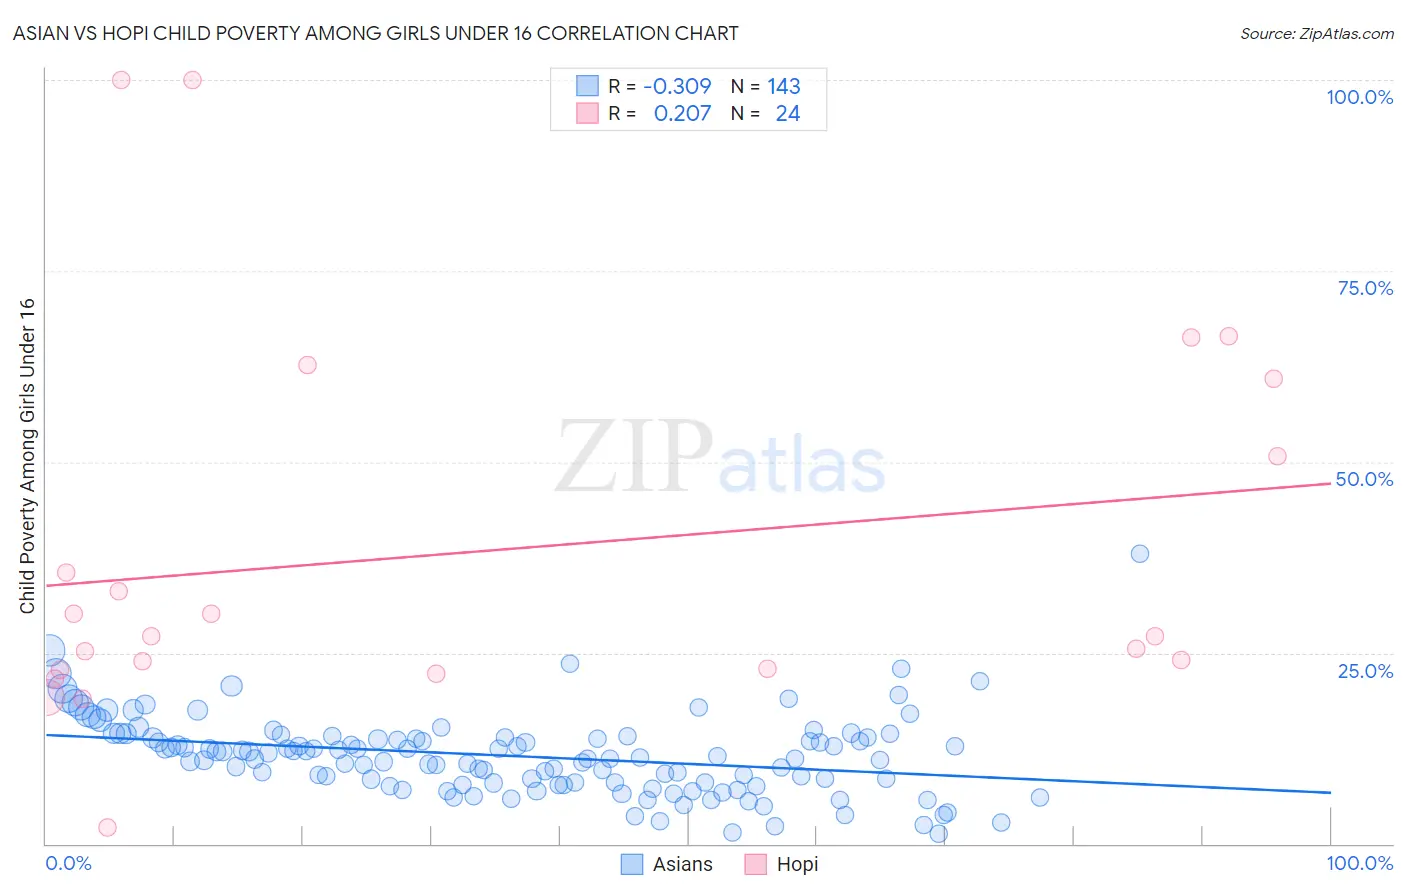
Asian vs Hopi Child Poverty Among Girls Under 16 Correlation Chart
The statistical analysis conducted on geographies consisting of 532,137,785 people shows a mild negative correlation between the proportion of Asians and poverty level among girls under the age of 16 in the United States with a correlation coefficient (R) of -0.309 and weighted average of 13.7%. Similarly, the statistical analysis conducted on geographies consisting of 74,572,915 people shows a weak positive correlation between the proportion of Hopi and poverty level among girls under the age of 16 in the United States with a correlation coefficient (R) of 0.207 and weighted average of 27.9%, a difference of 103.8%.
Child Poverty Among Girls Under 16 Correlation Summary
| Measurement | Asian | Hopi |
| Minimum | 1.3% | 2.1% |
| Maximum | 38.0% | 100.0% |
| Range | 36.7% | 97.9% |
| Mean | 11.5% | 38.3% |
| Median | 11.4% | 27.2% |
| Interquartile 25% (IQ1) | 8.0% | 22.8% |
| Interquartile 75% (IQ3) | 13.9% | 55.8% |
| Interquartile Range (IQR) | 5.9% | 33.0% |
| Standard Deviation (Sample) | 5.2% | 25.3% |
| Standard Deviation (Population) | 5.2% | 24.7% |
Similar Demographics by Child Poverty Among Girls Under 16
Demographics Similar to Asians by Child Poverty Among Girls Under 16
In terms of child poverty among girls under 16, the demographic groups most similar to Asians are Turkish (13.7%, a difference of 0.12%), Danish (13.7%, a difference of 0.16%), Swedish (13.7%, a difference of 0.19%), Maltese (13.7%, a difference of 0.24%), and Bolivian (13.6%, a difference of 0.67%).
| Demographics | Rating | Rank | Child Poverty Among Girls Under 16 |
| Norwegians | 99.9 /100 | #23 | Exceptional 13.3% |
| Immigrants | Eastern Asia | 99.9 /100 | #24 | Exceptional 13.4% |
| Immigrants | China | 99.8 /100 | #25 | Exceptional 13.4% |
| Eastern Europeans | 99.8 /100 | #26 | Exceptional 13.5% |
| Latvians | 99.8 /100 | #27 | Exceptional 13.5% |
| Tongans | 99.8 /100 | #28 | Exceptional 13.6% |
| Bolivians | 99.8 /100 | #29 | Exceptional 13.6% |
| Asians | 99.7 /100 | #30 | Exceptional 13.7% |
| Turks | 99.7 /100 | #31 | Exceptional 13.7% |
| Danes | 99.7 /100 | #32 | Exceptional 13.7% |
| Swedes | 99.7 /100 | #33 | Exceptional 13.7% |
| Maltese | 99.7 /100 | #34 | Exceptional 13.7% |
| Immigrants | Northern Europe | 99.6 /100 | #35 | Exceptional 13.8% |
| Russians | 99.6 /100 | #36 | Exceptional 13.9% |
| Lithuanians | 99.6 /100 | #37 | Exceptional 13.9% |
Demographics Similar to Hopi by Child Poverty Among Girls Under 16
In terms of child poverty among girls under 16, the demographic groups most similar to Hopi are Pima (28.2%, a difference of 1.3%), Yuman (27.1%, a difference of 2.9%), Crow (26.4%, a difference of 5.7%), Immigrants from Yemen (29.5%, a difference of 5.9%), and Cheyenne (26.3%, a difference of 6.0%).
| Demographics | Rating | Rank | Child Poverty Among Girls Under 16 |
| Blacks/African Americans | 0.0 /100 | #333 | Tragic 24.7% |
| Menominee | 0.0 /100 | #334 | Tragic 25.0% |
| Pueblo | 0.0 /100 | #335 | Tragic 25.2% |
| Sioux | 0.0 /100 | #336 | Tragic 25.6% |
| Yup'ik | 0.0 /100 | #337 | Tragic 25.8% |
| Cheyenne | 0.0 /100 | #338 | Tragic 26.3% |
| Crow | 0.0 /100 | #339 | Tragic 26.4% |
| Yuman | 0.0 /100 | #340 | Tragic 27.1% |
| Hopi | 0.0 /100 | #341 | Tragic 27.9% |
| Pima | 0.0 /100 | #342 | Tragic 28.2% |
| Immigrants | Yemen | 0.0 /100 | #343 | Tragic 29.5% |
| Navajo | 0.0 /100 | #344 | Tragic 30.5% |
| Lumbee | 0.0 /100 | #345 | Tragic 30.7% |
| Tohono O'odham | 0.0 /100 | #346 | Tragic 31.6% |
| Puerto Ricans | 0.0 /100 | #347 | Tragic 32.7% |