Immigrants from Laos vs Aleut Single Father Poverty
COMPARE
Immigrants from Laos
Aleut
Single Father Poverty
Single Father Poverty Comparison
Immigrants from Laos
Aleuts
15.1%
SINGLE FATHER POVERTY
99.9/ 100
METRIC RATING
56th/ 347
METRIC RANK
16.4%
SINGLE FATHER POVERTY
35.3/ 100
METRIC RATING
183rd/ 347
METRIC RANK
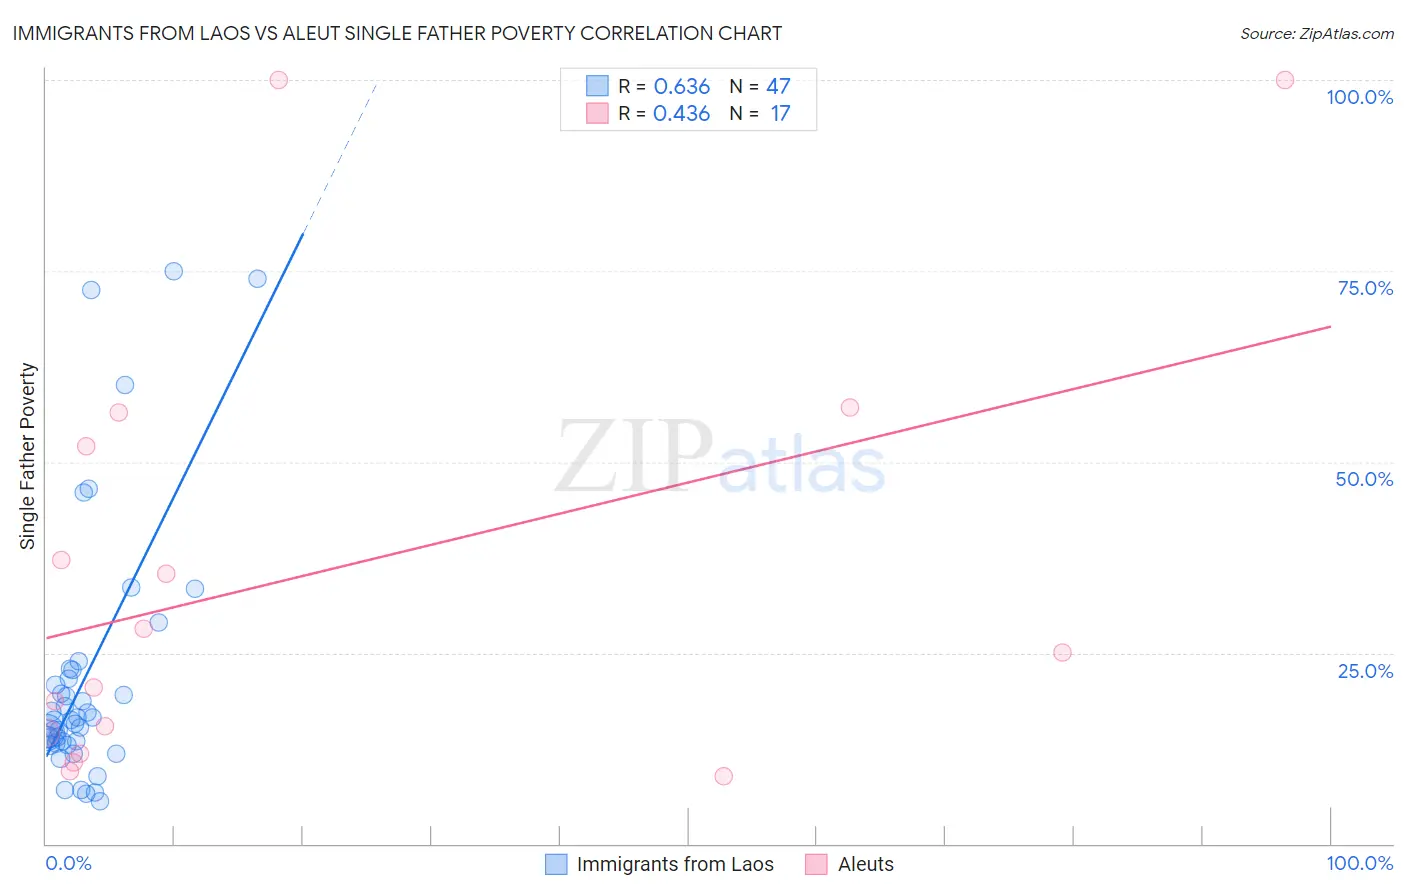
Immigrants from Laos vs Aleut Single Father Poverty Correlation Chart
The statistical analysis conducted on geographies consisting of 175,462,084 people shows a significant positive correlation between the proportion of Immigrants from Laos and poverty level among single fathers in the United States with a correlation coefficient (R) of 0.636 and weighted average of 15.1%. Similarly, the statistical analysis conducted on geographies consisting of 56,707,511 people shows a moderate positive correlation between the proportion of Aleuts and poverty level among single fathers in the United States with a correlation coefficient (R) of 0.436 and weighted average of 16.4%, a difference of 8.9%.
Single Father Poverty Correlation Summary
| Measurement | Immigrants from Laos | Aleut |
| Minimum | 5.5% | 8.8% |
| Maximum | 75.0% | 100.0% |
| Range | 69.5% | 91.2% |
| Mean | 22.0% | 35.4% |
| Median | 16.2% | 25.0% |
| Interquartile 25% (IQ1) | 13.2% | 13.1% |
| Interquartile 75% (IQ3) | 22.7% | 54.3% |
| Interquartile Range (IQR) | 9.6% | 41.1% |
| Standard Deviation (Sample) | 17.3% | 29.1% |
| Standard Deviation (Population) | 17.1% | 28.3% |
Similar Demographics by Single Father Poverty
Demographics Similar to Immigrants from Laos by Single Father Poverty
In terms of single father poverty, the demographic groups most similar to Immigrants from Laos are Laotian (15.1%, a difference of 0.090%), Hawaiian (15.1%, a difference of 0.14%), Guamanian/Chamorro (15.1%, a difference of 0.24%), Immigrants from Bulgaria (15.0%, a difference of 0.28%), and Immigrants from Uzbekistan (15.0%, a difference of 0.32%).
| Demographics | Rating | Rank | Single Father Poverty |
| Immigrants | Eastern Asia | 99.9 /100 | #49 | Exceptional 15.0% |
| Bhutanese | 99.9 /100 | #50 | Exceptional 15.0% |
| Immigrants | Pakistan | 99.9 /100 | #51 | Exceptional 15.0% |
| Immigrants | El Salvador | 99.9 /100 | #52 | Exceptional 15.0% |
| Immigrants | Kenya | 99.9 /100 | #53 | Exceptional 15.0% |
| Immigrants | Uzbekistan | 99.9 /100 | #54 | Exceptional 15.0% |
| Immigrants | Bulgaria | 99.9 /100 | #55 | Exceptional 15.0% |
| Immigrants | Laos | 99.9 /100 | #56 | Exceptional 15.1% |
| Laotians | 99.9 /100 | #57 | Exceptional 15.1% |
| Hawaiians | 99.9 /100 | #58 | Exceptional 15.1% |
| Guamanians/Chamorros | 99.9 /100 | #59 | Exceptional 15.1% |
| Puget Sound Salish | 99.8 /100 | #60 | Exceptional 15.2% |
| Immigrants | Bosnia and Herzegovina | 99.8 /100 | #61 | Exceptional 15.2% |
| Immigrants | Armenia | 99.8 /100 | #62 | Exceptional 15.2% |
| Immigrants | Sweden | 99.8 /100 | #63 | Exceptional 15.2% |
Demographics Similar to Aleuts by Single Father Poverty
In terms of single father poverty, the demographic groups most similar to Aleuts are Immigrants from Italy (16.4%, a difference of 0.020%), Immigrants from Western Africa (16.4%, a difference of 0.030%), Cambodian (16.4%, a difference of 0.030%), Panamanian (16.4%, a difference of 0.080%), and Immigrants from Latin America (16.4%, a difference of 0.090%).
| Demographics | Rating | Rank | Single Father Poverty |
| Vietnamese | 48.0 /100 | #176 | Average 16.3% |
| Immigrants | South Africa | 44.2 /100 | #177 | Average 16.3% |
| Immigrants | Cuba | 41.6 /100 | #178 | Average 16.4% |
| Serbians | 40.9 /100 | #179 | Average 16.4% |
| Immigrants | Latin America | 37.2 /100 | #180 | Fair 16.4% |
| Immigrants | Western Africa | 36.0 /100 | #181 | Fair 16.4% |
| Immigrants | Italy | 35.7 /100 | #182 | Fair 16.4% |
| Aleuts | 35.3 /100 | #183 | Fair 16.4% |
| Cambodians | 34.6 /100 | #184 | Fair 16.4% |
| Panamanians | 33.6 /100 | #185 | Fair 16.4% |
| Immigrants | Venezuela | 31.0 /100 | #186 | Fair 16.4% |
| Ukrainians | 30.4 /100 | #187 | Fair 16.4% |
| Russians | 30.1 /100 | #188 | Fair 16.4% |
| Latvians | 28.9 /100 | #189 | Fair 16.5% |
| Immigrants | Burma/Myanmar | 28.0 /100 | #190 | Fair 16.5% |