Immigrants from Laos vs Bolivian Single Father Poverty
COMPARE
Immigrants from Laos
Bolivian
Single Father Poverty
Single Father Poverty Comparison
Immigrants from Laos
Bolivians
15.1%
SINGLE FATHER POVERTY
99.9/ 100
METRIC RATING
56th/ 347
METRIC RANK
14.7%
SINGLE FATHER POVERTY
100.0/ 100
METRIC RATING
38th/ 347
METRIC RANK
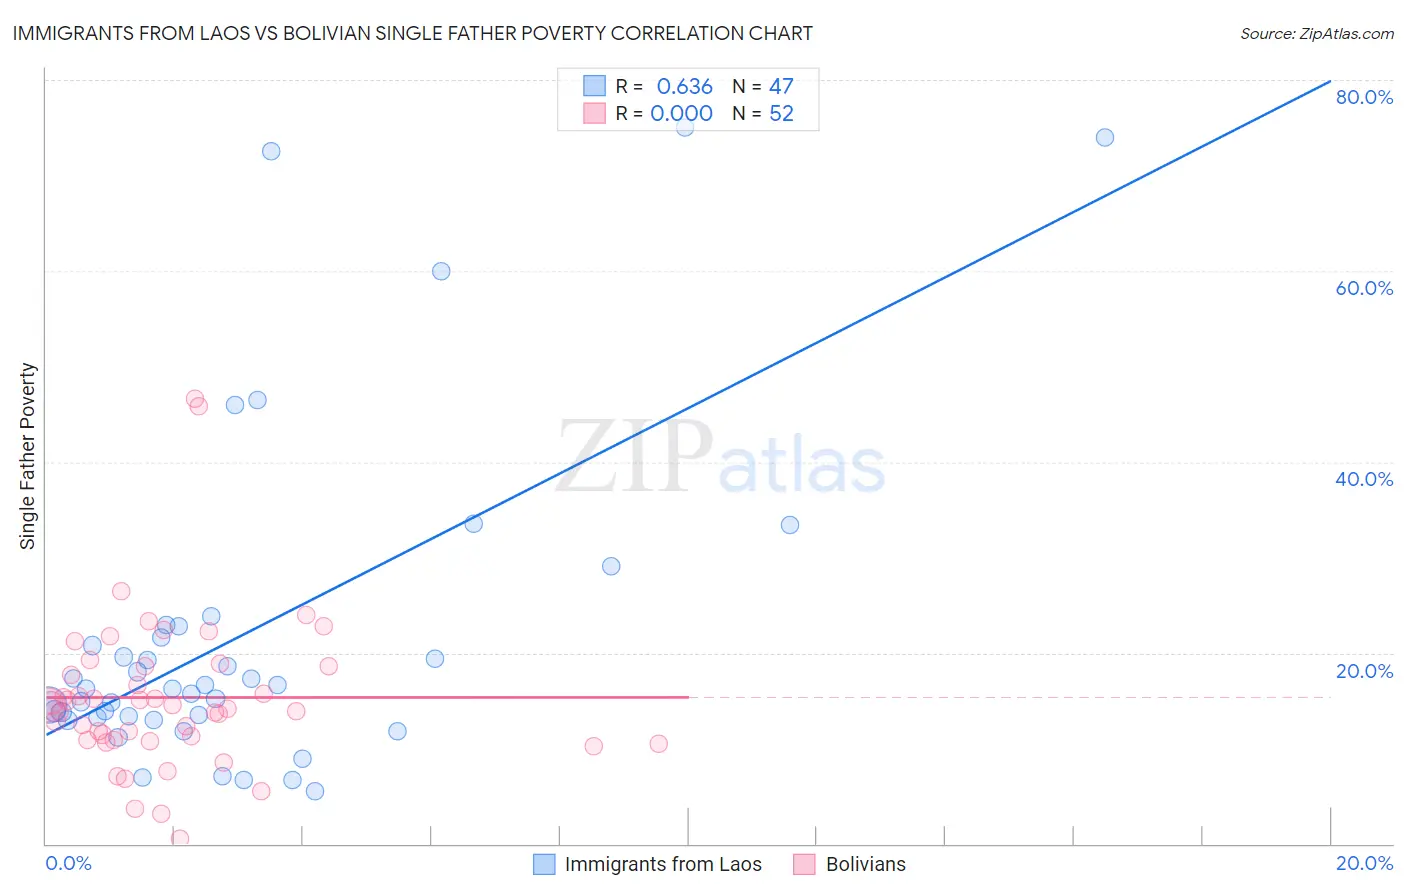
Immigrants from Laos vs Bolivian Single Father Poverty Correlation Chart
The statistical analysis conducted on geographies consisting of 175,462,084 people shows a significant positive correlation between the proportion of Immigrants from Laos and poverty level among single fathers in the United States with a correlation coefficient (R) of 0.636 and weighted average of 15.1%. Similarly, the statistical analysis conducted on geographies consisting of 157,877,648 people shows no correlation between the proportion of Bolivians and poverty level among single fathers in the United States with a correlation coefficient (R) of 0.000 and weighted average of 14.7%, a difference of 2.4%.
Single Father Poverty Correlation Summary
| Measurement | Immigrants from Laos | Bolivian |
| Minimum | 5.5% | 0.47% |
| Maximum | 75.0% | 46.7% |
| Range | 69.5% | 46.2% |
| Mean | 22.0% | 15.3% |
| Median | 16.2% | 14.3% |
| Interquartile 25% (IQ1) | 13.2% | 10.9% |
| Interquartile 75% (IQ3) | 22.7% | 18.6% |
| Interquartile Range (IQR) | 9.6% | 7.7% |
| Standard Deviation (Sample) | 17.3% | 8.3% |
| Standard Deviation (Population) | 17.1% | 8.2% |
Demographics Similar to Immigrants from Laos and Bolivians by Single Father Poverty
In terms of single father poverty, the demographic groups most similar to Immigrants from Laos are Laotian (15.1%, a difference of 0.090%), Immigrants from Bulgaria (15.0%, a difference of 0.28%), Immigrants from Uzbekistan (15.0%, a difference of 0.32%), Immigrants from Kenya (15.0%, a difference of 0.51%), and Immigrants from El Salvador (15.0%, a difference of 0.54%). Similarly, the demographic groups most similar to Bolivians are Immigrants from Eastern Africa (14.7%, a difference of 0.010%), Immigrants from Asia (14.7%, a difference of 0.18%), Pima (14.8%, a difference of 0.37%), Indian (Asian) (14.8%, a difference of 0.54%), and Immigrants from Nepal (14.8%, a difference of 0.55%).
| Demographics | Rating | Rank | Single Father Poverty |
| Immigrants | Eastern Africa | 100.0 /100 | #37 | Exceptional 14.7% |
| Bolivians | 100.0 /100 | #38 | Exceptional 14.7% |
| Immigrants | Asia | 100.0 /100 | #39 | Exceptional 14.7% |
| Pima | 100.0 /100 | #40 | Exceptional 14.8% |
| Indians (Asian) | 100.0 /100 | #41 | Exceptional 14.8% |
| Immigrants | Nepal | 100.0 /100 | #42 | Exceptional 14.8% |
| Immigrants | Eritrea | 100.0 /100 | #43 | Exceptional 14.8% |
| Salvadorans | 100.0 /100 | #44 | Exceptional 14.9% |
| Immigrants | Somalia | 100.0 /100 | #45 | Exceptional 14.9% |
| Immigrants | Cambodia | 99.9 /100 | #46 | Exceptional 14.9% |
| Immigrants | China | 99.9 /100 | #47 | Exceptional 14.9% |
| Malaysians | 99.9 /100 | #48 | Exceptional 14.9% |
| Immigrants | Eastern Asia | 99.9 /100 | #49 | Exceptional 15.0% |
| Bhutanese | 99.9 /100 | #50 | Exceptional 15.0% |
| Immigrants | Pakistan | 99.9 /100 | #51 | Exceptional 15.0% |
| Immigrants | El Salvador | 99.9 /100 | #52 | Exceptional 15.0% |
| Immigrants | Kenya | 99.9 /100 | #53 | Exceptional 15.0% |
| Immigrants | Uzbekistan | 99.9 /100 | #54 | Exceptional 15.0% |
| Immigrants | Bulgaria | 99.9 /100 | #55 | Exceptional 15.0% |
| Immigrants | Laos | 99.9 /100 | #56 | Exceptional 15.1% |
| Laotians | 99.9 /100 | #57 | Exceptional 15.1% |