Immigrants from Kuwait vs Inupiat Female Poverty Among 25-34 Year Olds
COMPARE
Immigrants from Kuwait
Inupiat
Female Poverty Among 25-34 Year Olds
Female Poverty Among 25-34 Year Olds Comparison
Immigrants from Kuwait
Inupiat
12.8%
FEMALE POVERTY AMONG 25-34 YEAR OLDS
93.1/ 100
METRIC RATING
117th/ 347
METRIC RANK
18.5%
FEMALE POVERTY AMONG 25-34 YEAR OLDS
0.0/ 100
METRIC RATING
325th/ 347
METRIC RANK
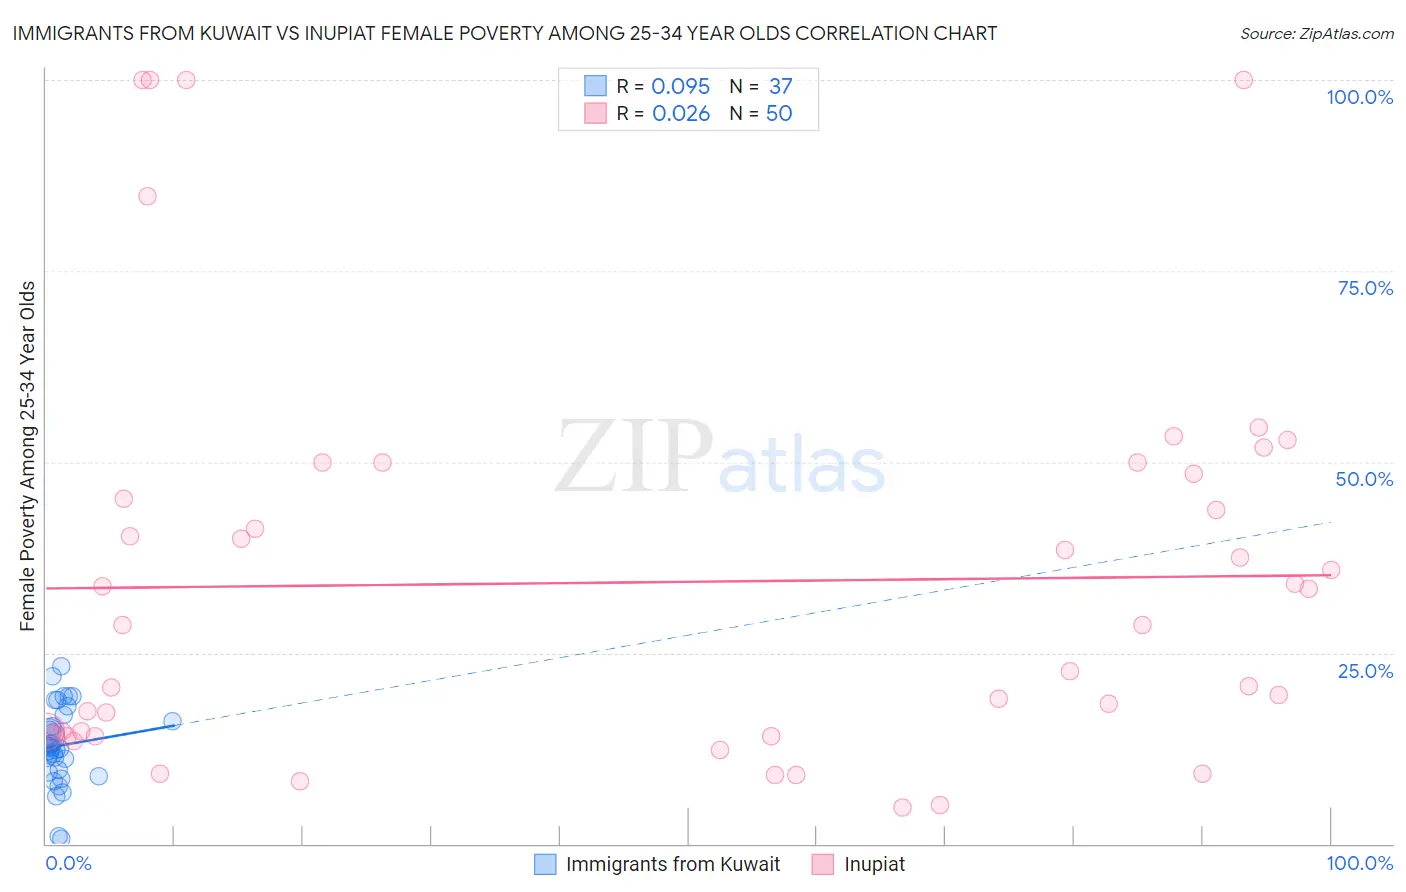
Immigrants from Kuwait vs Inupiat Female Poverty Among 25-34 Year Olds Correlation Chart
The statistical analysis conducted on geographies consisting of 136,324,073 people shows a slight positive correlation between the proportion of Immigrants from Kuwait and poverty level among females between the ages 25 and 34 in the United States with a correlation coefficient (R) of 0.095 and weighted average of 12.8%. Similarly, the statistical analysis conducted on geographies consisting of 95,902,522 people shows no correlation between the proportion of Inupiat and poverty level among females between the ages 25 and 34 in the United States with a correlation coefficient (R) of 0.026 and weighted average of 18.5%, a difference of 44.8%.
Female Poverty Among 25-34 Year Olds Correlation Summary
| Measurement | Immigrants from Kuwait | Inupiat |
| Minimum | 0.66% | 4.7% |
| Maximum | 23.2% | 100.0% |
| Range | 22.6% | 95.3% |
| Mean | 12.9% | 34.2% |
| Median | 12.6% | 28.6% |
| Interquartile 25% (IQ1) | 9.5% | 14.4% |
| Interquartile 75% (IQ3) | 16.5% | 48.5% |
| Interquartile Range (IQR) | 6.9% | 34.1% |
| Standard Deviation (Sample) | 5.1% | 26.0% |
| Standard Deviation (Population) | 5.1% | 25.7% |
Similar Demographics by Female Poverty Among 25-34 Year Olds
Demographics Similar to Immigrants from Kuwait by Female Poverty Among 25-34 Year Olds
In terms of female poverty among 25-34 year olds, the demographic groups most similar to Immigrants from Kuwait are Mongolian (12.8%, a difference of 0.010%), Immigrants from Nepal (12.8%, a difference of 0.020%), Carpatho Rusyn (12.8%, a difference of 0.030%), Chilean (12.8%, a difference of 0.060%), and Immigrants from Brazil (12.8%, a difference of 0.090%).
| Demographics | Rating | Rank | Female Poverty Among 25-34 Year Olds |
| Australians | 94.1 /100 | #110 | Exceptional 12.8% |
| Danes | 93.9 /100 | #111 | Exceptional 12.8% |
| Immigrants | Morocco | 93.9 /100 | #112 | Exceptional 12.8% |
| Immigrants | Syria | 93.8 /100 | #113 | Exceptional 12.8% |
| Immigrants | Southern Europe | 93.6 /100 | #114 | Exceptional 12.8% |
| Immigrants | Brazil | 93.3 /100 | #115 | Exceptional 12.8% |
| Chileans | 93.2 /100 | #116 | Exceptional 12.8% |
| Immigrants | Kuwait | 93.1 /100 | #117 | Exceptional 12.8% |
| Mongolians | 93.0 /100 | #118 | Exceptional 12.8% |
| Immigrants | Nepal | 93.0 /100 | #119 | Exceptional 12.8% |
| Carpatho Rusyns | 93.0 /100 | #120 | Exceptional 12.8% |
| Romanians | 92.8 /100 | #121 | Exceptional 12.8% |
| Immigrants | Western Asia | 92.7 /100 | #122 | Exceptional 12.8% |
| Slovenes | 92.7 /100 | #123 | Exceptional 12.8% |
| Immigrants | Netherlands | 92.0 /100 | #124 | Exceptional 12.8% |
Demographics Similar to Inupiat by Female Poverty Among 25-34 Year Olds
In terms of female poverty among 25-34 year olds, the demographic groups most similar to Inupiat are Dutch West Indian (18.4%, a difference of 0.52%), Seminole (18.3%, a difference of 1.5%), Central American Indian (18.2%, a difference of 1.8%), Black/African American (18.9%, a difference of 2.0%), and Choctaw (18.1%, a difference of 2.6%).
| Demographics | Rating | Rank | Female Poverty Among 25-34 Year Olds |
| Ute | 0.0 /100 | #318 | Tragic 17.9% |
| Menominee | 0.0 /100 | #319 | Tragic 18.0% |
| Chippewa | 0.0 /100 | #320 | Tragic 18.0% |
| Choctaw | 0.0 /100 | #321 | Tragic 18.1% |
| Central American Indians | 0.0 /100 | #322 | Tragic 18.2% |
| Seminole | 0.0 /100 | #323 | Tragic 18.3% |
| Dutch West Indians | 0.0 /100 | #324 | Tragic 18.4% |
| Inupiat | 0.0 /100 | #325 | Tragic 18.5% |
| Blacks/African Americans | 0.0 /100 | #326 | Tragic 18.9% |
| Cheyenne | 0.0 /100 | #327 | Tragic 19.1% |
| Alaskan Athabascans | 0.0 /100 | #328 | Tragic 19.1% |
| Creek | 0.0 /100 | #329 | Tragic 19.2% |
| Paiute | 0.0 /100 | #330 | Tragic 19.6% |
| Kiowa | 0.0 /100 | #331 | Tragic 19.7% |
| Immigrants | Yemen | 0.0 /100 | #332 | Tragic 19.8% |