Taiwanese vs Inupiat Female Poverty Among 25-34 Year Olds
COMPARE
Taiwanese
Inupiat
Female Poverty Among 25-34 Year Olds
Female Poverty Among 25-34 Year Olds Comparison
Taiwanese
Inupiat
11.8%
FEMALE POVERTY AMONG 25-34 YEAR OLDS
99.8/ 100
METRIC RATING
37th/ 347
METRIC RANK
18.5%
FEMALE POVERTY AMONG 25-34 YEAR OLDS
0.0/ 100
METRIC RATING
325th/ 347
METRIC RANK
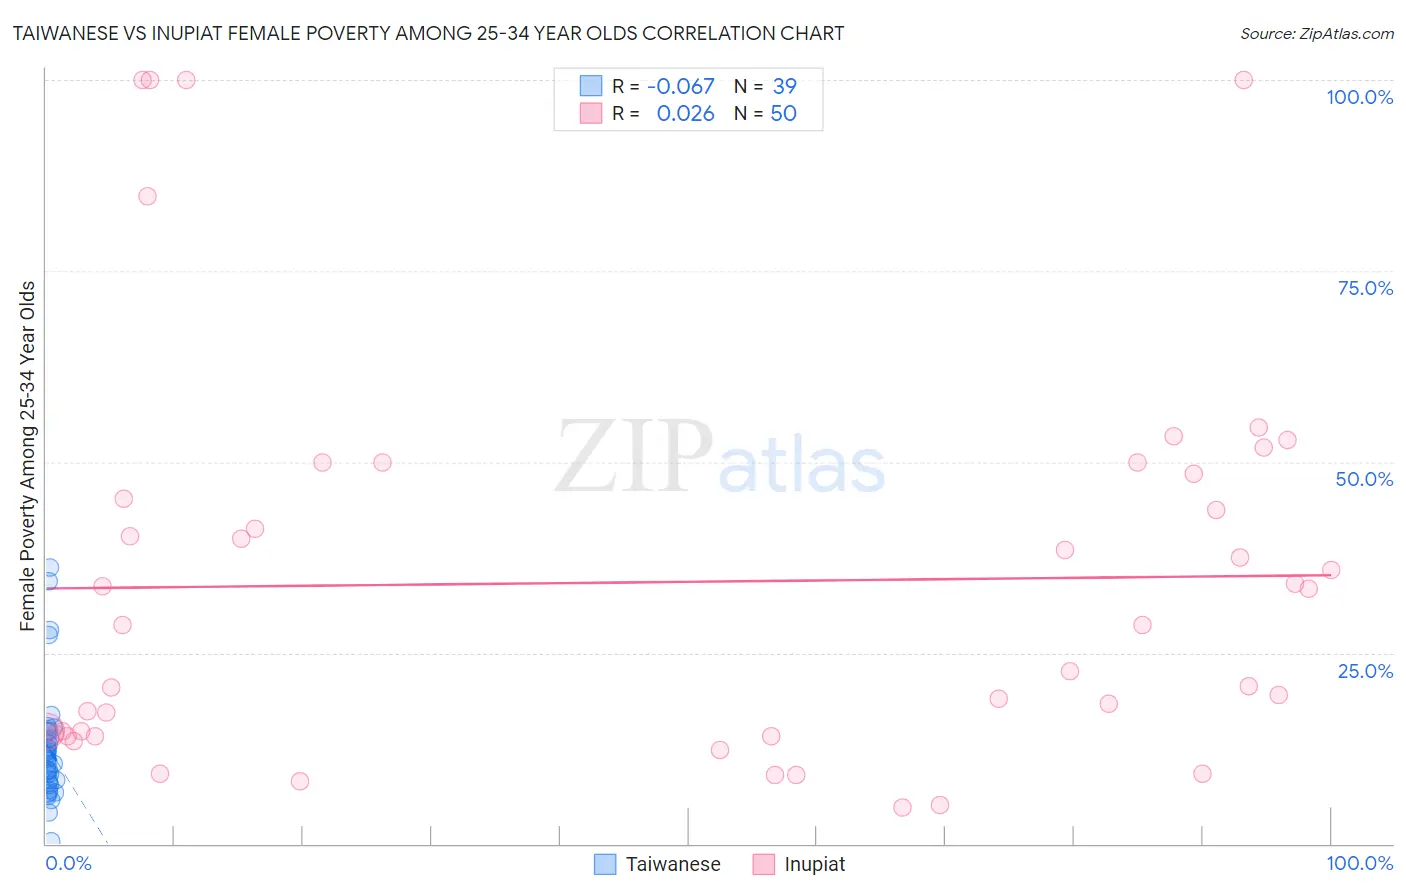
Taiwanese vs Inupiat Female Poverty Among 25-34 Year Olds Correlation Chart
The statistical analysis conducted on geographies consisting of 31,656,298 people shows a slight negative correlation between the proportion of Taiwanese and poverty level among females between the ages 25 and 34 in the United States with a correlation coefficient (R) of -0.067 and weighted average of 11.8%. Similarly, the statistical analysis conducted on geographies consisting of 95,902,522 people shows no correlation between the proportion of Inupiat and poverty level among females between the ages 25 and 34 in the United States with a correlation coefficient (R) of 0.026 and weighted average of 18.5%, a difference of 57.5%.
Female Poverty Among 25-34 Year Olds Correlation Summary
| Measurement | Taiwanese | Inupiat |
| Minimum | 0.25% | 4.7% |
| Maximum | 36.2% | 100.0% |
| Range | 36.0% | 95.3% |
| Mean | 12.4% | 34.2% |
| Median | 11.2% | 28.6% |
| Interquartile 25% (IQ1) | 8.0% | 14.4% |
| Interquartile 75% (IQ3) | 14.7% | 48.5% |
| Interquartile Range (IQR) | 6.7% | 34.1% |
| Standard Deviation (Sample) | 7.5% | 26.0% |
| Standard Deviation (Population) | 7.4% | 25.7% |
Similar Demographics by Female Poverty Among 25-34 Year Olds
Demographics Similar to Taiwanese by Female Poverty Among 25-34 Year Olds
In terms of female poverty among 25-34 year olds, the demographic groups most similar to Taiwanese are Immigrants from North Macedonia (11.8%, a difference of 0.070%), Immigrants from Sri Lanka (11.8%, a difference of 0.16%), Latvian (11.8%, a difference of 0.32%), Immigrants from Bulgaria (11.8%, a difference of 0.48%), and Immigrants from Indonesia (11.8%, a difference of 0.61%).
| Demographics | Rating | Rank | Female Poverty Among 25-34 Year Olds |
| Cypriots | 99.9 /100 | #30 | Exceptional 11.5% |
| Immigrants | Japan | 99.9 /100 | #31 | Exceptional 11.6% |
| Immigrants | Asia | 99.9 /100 | #32 | Exceptional 11.6% |
| Immigrants | Poland | 99.9 /100 | #33 | Exceptional 11.6% |
| Zimbabweans | 99.9 /100 | #34 | Exceptional 11.7% |
| Cambodians | 99.9 /100 | #35 | Exceptional 11.7% |
| Immigrants | Sri Lanka | 99.8 /100 | #36 | Exceptional 11.8% |
| Taiwanese | 99.8 /100 | #37 | Exceptional 11.8% |
| Immigrants | North Macedonia | 99.8 /100 | #38 | Exceptional 11.8% |
| Latvians | 99.8 /100 | #39 | Exceptional 11.8% |
| Immigrants | Bulgaria | 99.8 /100 | #40 | Exceptional 11.8% |
| Immigrants | Indonesia | 99.8 /100 | #41 | Exceptional 11.8% |
| Immigrants | Turkey | 99.7 /100 | #42 | Exceptional 11.9% |
| Egyptians | 99.7 /100 | #43 | Exceptional 11.9% |
| Immigrants | Australia | 99.7 /100 | #44 | Exceptional 11.9% |
Demographics Similar to Inupiat by Female Poverty Among 25-34 Year Olds
In terms of female poverty among 25-34 year olds, the demographic groups most similar to Inupiat are Dutch West Indian (18.4%, a difference of 0.52%), Seminole (18.3%, a difference of 1.5%), Central American Indian (18.2%, a difference of 1.8%), Black/African American (18.9%, a difference of 2.0%), and Choctaw (18.1%, a difference of 2.6%).
| Demographics | Rating | Rank | Female Poverty Among 25-34 Year Olds |
| Ute | 0.0 /100 | #318 | Tragic 17.9% |
| Menominee | 0.0 /100 | #319 | Tragic 18.0% |
| Chippewa | 0.0 /100 | #320 | Tragic 18.0% |
| Choctaw | 0.0 /100 | #321 | Tragic 18.1% |
| Central American Indians | 0.0 /100 | #322 | Tragic 18.2% |
| Seminole | 0.0 /100 | #323 | Tragic 18.3% |
| Dutch West Indians | 0.0 /100 | #324 | Tragic 18.4% |
| Inupiat | 0.0 /100 | #325 | Tragic 18.5% |
| Blacks/African Americans | 0.0 /100 | #326 | Tragic 18.9% |
| Cheyenne | 0.0 /100 | #327 | Tragic 19.1% |
| Alaskan Athabascans | 0.0 /100 | #328 | Tragic 19.1% |
| Creek | 0.0 /100 | #329 | Tragic 19.2% |
| Paiute | 0.0 /100 | #330 | Tragic 19.6% |
| Kiowa | 0.0 /100 | #331 | Tragic 19.7% |
| Immigrants | Yemen | 0.0 /100 | #332 | Tragic 19.8% |