Scandinavian vs Inupiat Female Poverty Among 25-34 Year Olds
COMPARE
Scandinavian
Inupiat
Female Poverty Among 25-34 Year Olds
Female Poverty Among 25-34 Year Olds Comparison
Scandinavians
Inupiat
13.1%
FEMALE POVERTY AMONG 25-34 YEAR OLDS
82.3/ 100
METRIC RATING
142nd/ 347
METRIC RANK
18.5%
FEMALE POVERTY AMONG 25-34 YEAR OLDS
0.0/ 100
METRIC RATING
325th/ 347
METRIC RANK
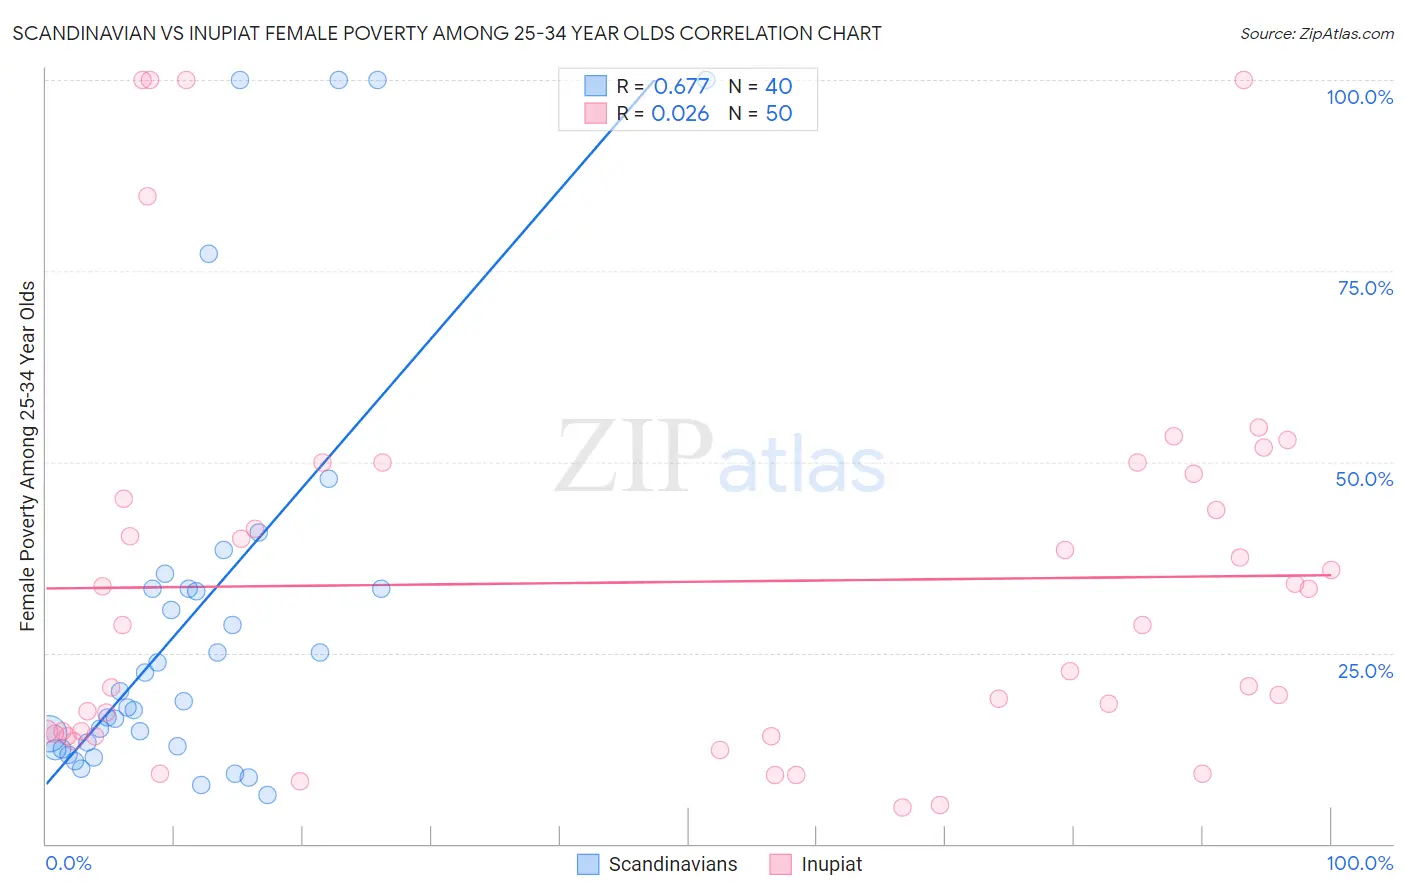
Scandinavian vs Inupiat Female Poverty Among 25-34 Year Olds Correlation Chart
The statistical analysis conducted on geographies consisting of 460,488,930 people shows a significant positive correlation between the proportion of Scandinavians and poverty level among females between the ages 25 and 34 in the United States with a correlation coefficient (R) of 0.677 and weighted average of 13.1%. Similarly, the statistical analysis conducted on geographies consisting of 95,902,522 people shows no correlation between the proportion of Inupiat and poverty level among females between the ages 25 and 34 in the United States with a correlation coefficient (R) of 0.026 and weighted average of 18.5%, a difference of 41.5%.
Female Poverty Among 25-34 Year Olds Correlation Summary
| Measurement | Scandinavian | Inupiat |
| Minimum | 6.4% | 4.7% |
| Maximum | 100.0% | 100.0% |
| Range | 93.6% | 95.3% |
| Mean | 30.1% | 34.2% |
| Median | 19.3% | 28.6% |
| Interquartile 25% (IQ1) | 12.6% | 14.4% |
| Interquartile 75% (IQ3) | 33.3% | 48.5% |
| Interquartile Range (IQR) | 20.7% | 34.1% |
| Standard Deviation (Sample) | 27.2% | 26.0% |
| Standard Deviation (Population) | 26.8% | 25.7% |
Similar Demographics by Female Poverty Among 25-34 Year Olds
Demographics Similar to Scandinavians by Female Poverty Among 25-34 Year Olds
In terms of female poverty among 25-34 year olds, the demographic groups most similar to Scandinavians are Israeli (13.1%, a difference of 0.060%), New Zealander (13.1%, a difference of 0.16%), Immigrants from Iraq (13.1%, a difference of 0.20%), Austrian (13.1%, a difference of 0.21%), and Brazilian (13.1%, a difference of 0.34%).
| Demographics | Rating | Rank | Female Poverty Among 25-34 Year Olds |
| South Africans | 85.7 /100 | #135 | Excellent 13.0% |
| Immigrants | England | 85.5 /100 | #136 | Excellent 13.0% |
| Immigrants | Chile | 84.6 /100 | #137 | Excellent 13.1% |
| Brazilians | 84.5 /100 | #138 | Excellent 13.1% |
| Austrians | 83.7 /100 | #139 | Excellent 13.1% |
| Immigrants | Iraq | 83.6 /100 | #140 | Excellent 13.1% |
| New Zealanders | 83.4 /100 | #141 | Excellent 13.1% |
| Scandinavians | 82.3 /100 | #142 | Excellent 13.1% |
| Israelis | 81.9 /100 | #143 | Excellent 13.1% |
| Native Hawaiians | 78.9 /100 | #144 | Good 13.2% |
| Colombians | 77.2 /100 | #145 | Good 13.2% |
| South Americans | 76.9 /100 | #146 | Good 13.2% |
| Europeans | 76.8 /100 | #147 | Good 13.2% |
| Lebanese | 76.8 /100 | #148 | Good 13.2% |
| Sierra Leoneans | 76.3 /100 | #149 | Good 13.2% |
Demographics Similar to Inupiat by Female Poverty Among 25-34 Year Olds
In terms of female poverty among 25-34 year olds, the demographic groups most similar to Inupiat are Dutch West Indian (18.4%, a difference of 0.52%), Seminole (18.3%, a difference of 1.5%), Central American Indian (18.2%, a difference of 1.8%), Black/African American (18.9%, a difference of 2.0%), and Choctaw (18.1%, a difference of 2.6%).
| Demographics | Rating | Rank | Female Poverty Among 25-34 Year Olds |
| Ute | 0.0 /100 | #318 | Tragic 17.9% |
| Menominee | 0.0 /100 | #319 | Tragic 18.0% |
| Chippewa | 0.0 /100 | #320 | Tragic 18.0% |
| Choctaw | 0.0 /100 | #321 | Tragic 18.1% |
| Central American Indians | 0.0 /100 | #322 | Tragic 18.2% |
| Seminole | 0.0 /100 | #323 | Tragic 18.3% |
| Dutch West Indians | 0.0 /100 | #324 | Tragic 18.4% |
| Inupiat | 0.0 /100 | #325 | Tragic 18.5% |
| Blacks/African Americans | 0.0 /100 | #326 | Tragic 18.9% |
| Cheyenne | 0.0 /100 | #327 | Tragic 19.1% |
| Alaskan Athabascans | 0.0 /100 | #328 | Tragic 19.1% |
| Creek | 0.0 /100 | #329 | Tragic 19.2% |
| Paiute | 0.0 /100 | #330 | Tragic 19.6% |
| Kiowa | 0.0 /100 | #331 | Tragic 19.7% |
| Immigrants | Yemen | 0.0 /100 | #332 | Tragic 19.8% |