Immigrants from Kuwait vs Immigrants from Albania Female Poverty Among 25-34 Year Olds
COMPARE
Immigrants from Kuwait
Immigrants from Albania
Female Poverty Among 25-34 Year Olds
Female Poverty Among 25-34 Year Olds Comparison
Immigrants from Kuwait
Immigrants from Albania
12.8%
FEMALE POVERTY AMONG 25-34 YEAR OLDS
93.1/ 100
METRIC RATING
117th/ 347
METRIC RANK
12.5%
FEMALE POVERTY AMONG 25-34 YEAR OLDS
97.1/ 100
METRIC RATING
90th/ 347
METRIC RANK
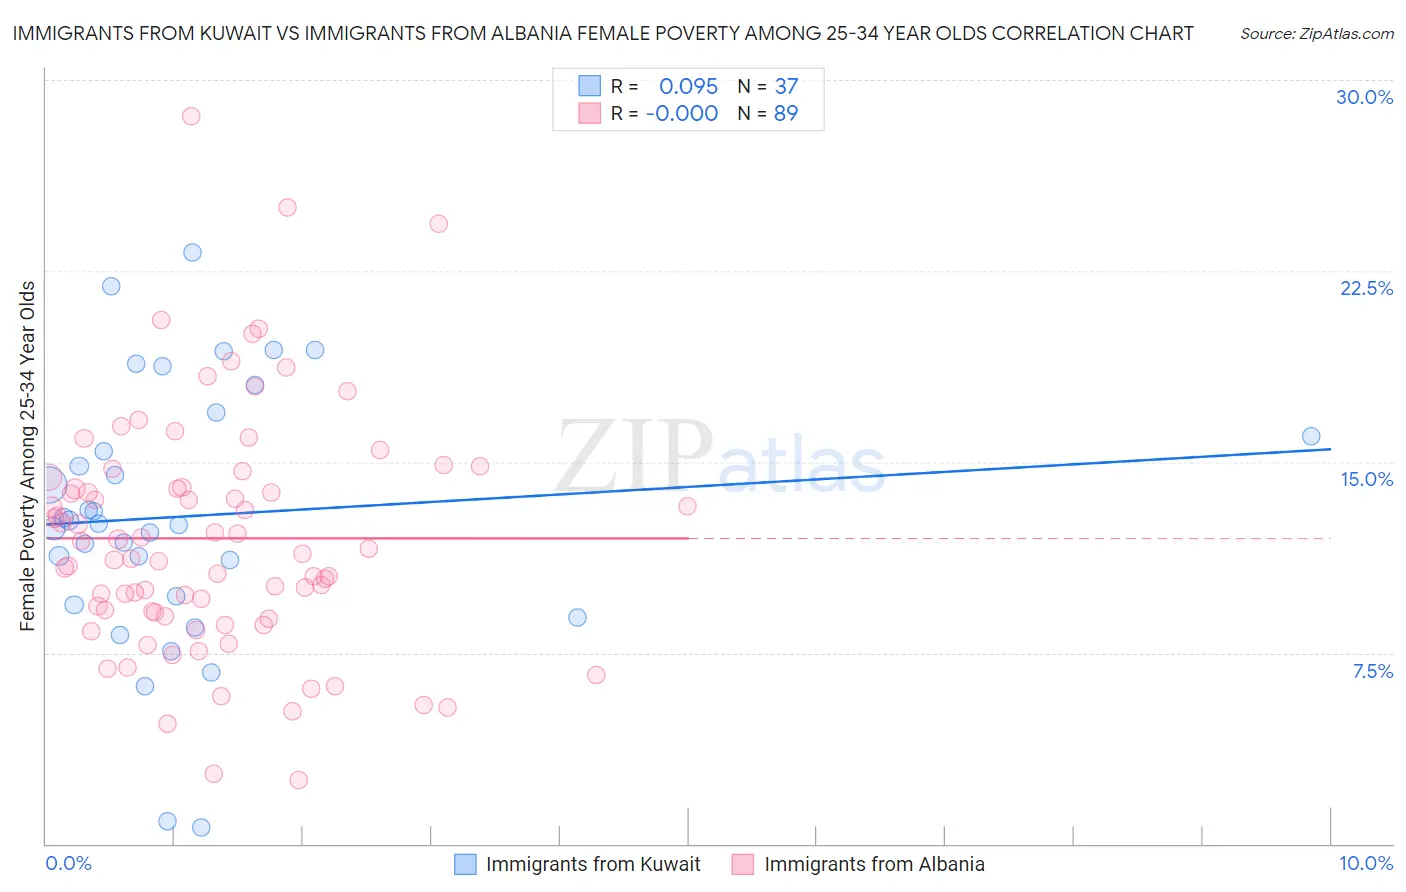
Immigrants from Kuwait vs Immigrants from Albania Female Poverty Among 25-34 Year Olds Correlation Chart
The statistical analysis conducted on geographies consisting of 136,324,073 people shows a slight positive correlation between the proportion of Immigrants from Kuwait and poverty level among females between the ages 25 and 34 in the United States with a correlation coefficient (R) of 0.095 and weighted average of 12.8%. Similarly, the statistical analysis conducted on geographies consisting of 118,599,932 people shows no correlation between the proportion of Immigrants from Albania and poverty level among females between the ages 25 and 34 in the United States with a correlation coefficient (R) of -0.000 and weighted average of 12.5%, a difference of 2.0%.
Female Poverty Among 25-34 Year Olds Correlation Summary
| Measurement | Immigrants from Kuwait | Immigrants from Albania |
| Minimum | 0.66% | 2.5% |
| Maximum | 23.2% | 28.6% |
| Range | 22.6% | 26.1% |
| Mean | 12.9% | 12.0% |
| Median | 12.6% | 11.4% |
| Interquartile 25% (IQ1) | 9.5% | 9.0% |
| Interquartile 75% (IQ3) | 16.5% | 14.2% |
| Interquartile Range (IQR) | 6.9% | 5.2% |
| Standard Deviation (Sample) | 5.1% | 4.7% |
| Standard Deviation (Population) | 5.1% | 4.7% |
Similar Demographics by Female Poverty Among 25-34 Year Olds
Demographics Similar to Immigrants from Kuwait by Female Poverty Among 25-34 Year Olds
In terms of female poverty among 25-34 year olds, the demographic groups most similar to Immigrants from Kuwait are Mongolian (12.8%, a difference of 0.010%), Immigrants from Nepal (12.8%, a difference of 0.020%), Carpatho Rusyn (12.8%, a difference of 0.030%), Chilean (12.8%, a difference of 0.060%), and Immigrants from Brazil (12.8%, a difference of 0.090%).
| Demographics | Rating | Rank | Female Poverty Among 25-34 Year Olds |
| Australians | 94.1 /100 | #110 | Exceptional 12.8% |
| Danes | 93.9 /100 | #111 | Exceptional 12.8% |
| Immigrants | Morocco | 93.9 /100 | #112 | Exceptional 12.8% |
| Immigrants | Syria | 93.8 /100 | #113 | Exceptional 12.8% |
| Immigrants | Southern Europe | 93.6 /100 | #114 | Exceptional 12.8% |
| Immigrants | Brazil | 93.3 /100 | #115 | Exceptional 12.8% |
| Chileans | 93.2 /100 | #116 | Exceptional 12.8% |
| Immigrants | Kuwait | 93.1 /100 | #117 | Exceptional 12.8% |
| Mongolians | 93.0 /100 | #118 | Exceptional 12.8% |
| Immigrants | Nepal | 93.0 /100 | #119 | Exceptional 12.8% |
| Carpatho Rusyns | 93.0 /100 | #120 | Exceptional 12.8% |
| Romanians | 92.8 /100 | #121 | Exceptional 12.8% |
| Immigrants | Western Asia | 92.7 /100 | #122 | Exceptional 12.8% |
| Slovenes | 92.7 /100 | #123 | Exceptional 12.8% |
| Immigrants | Netherlands | 92.0 /100 | #124 | Exceptional 12.8% |
Demographics Similar to Immigrants from Albania by Female Poverty Among 25-34 Year Olds
In terms of female poverty among 25-34 year olds, the demographic groups most similar to Immigrants from Albania are Norwegian (12.6%, a difference of 0.10%), Immigrants from Armenia (12.6%, a difference of 0.11%), Palestinian (12.6%, a difference of 0.14%), Italian (12.5%, a difference of 0.15%), and Immigrants from France (12.6%, a difference of 0.20%).
| Demographics | Rating | Rank | Female Poverty Among 25-34 Year Olds |
| Albanians | 97.7 /100 | #83 | Exceptional 12.5% |
| Immigrants | Latvia | 97.7 /100 | #84 | Exceptional 12.5% |
| Immigrants | South Eastern Asia | 97.6 /100 | #85 | Exceptional 12.5% |
| Croatians | 97.5 /100 | #86 | Exceptional 12.5% |
| Argentineans | 97.5 /100 | #87 | Exceptional 12.5% |
| Immigrants | Austria | 97.4 /100 | #88 | Exceptional 12.5% |
| Italians | 97.2 /100 | #89 | Exceptional 12.5% |
| Immigrants | Albania | 97.1 /100 | #90 | Exceptional 12.5% |
| Norwegians | 96.9 /100 | #91 | Exceptional 12.6% |
| Immigrants | Armenia | 96.9 /100 | #92 | Exceptional 12.6% |
| Palestinians | 96.9 /100 | #93 | Exceptional 12.6% |
| Immigrants | France | 96.8 /100 | #94 | Exceptional 12.6% |
| Ukrainians | 96.7 /100 | #95 | Exceptional 12.6% |
| Immigrants | Zimbabwe | 96.7 /100 | #96 | Exceptional 12.6% |
| Immigrants | Northern Africa | 96.6 /100 | #97 | Exceptional 12.6% |