Yup'ik vs Inupiat Female Poverty Among 25-34 Year Olds
COMPARE
Yup'ik
Inupiat
Female Poverty Among 25-34 Year Olds
Female Poverty Among 25-34 Year Olds Comparison
Yup'ik
Inupiat
24.3%
FEMALE POVERTY AMONG 25-34 YEAR OLDS
0.0/ 100
METRIC RATING
343rd/ 347
METRIC RANK
18.5%
FEMALE POVERTY AMONG 25-34 YEAR OLDS
0.0/ 100
METRIC RATING
325th/ 347
METRIC RANK
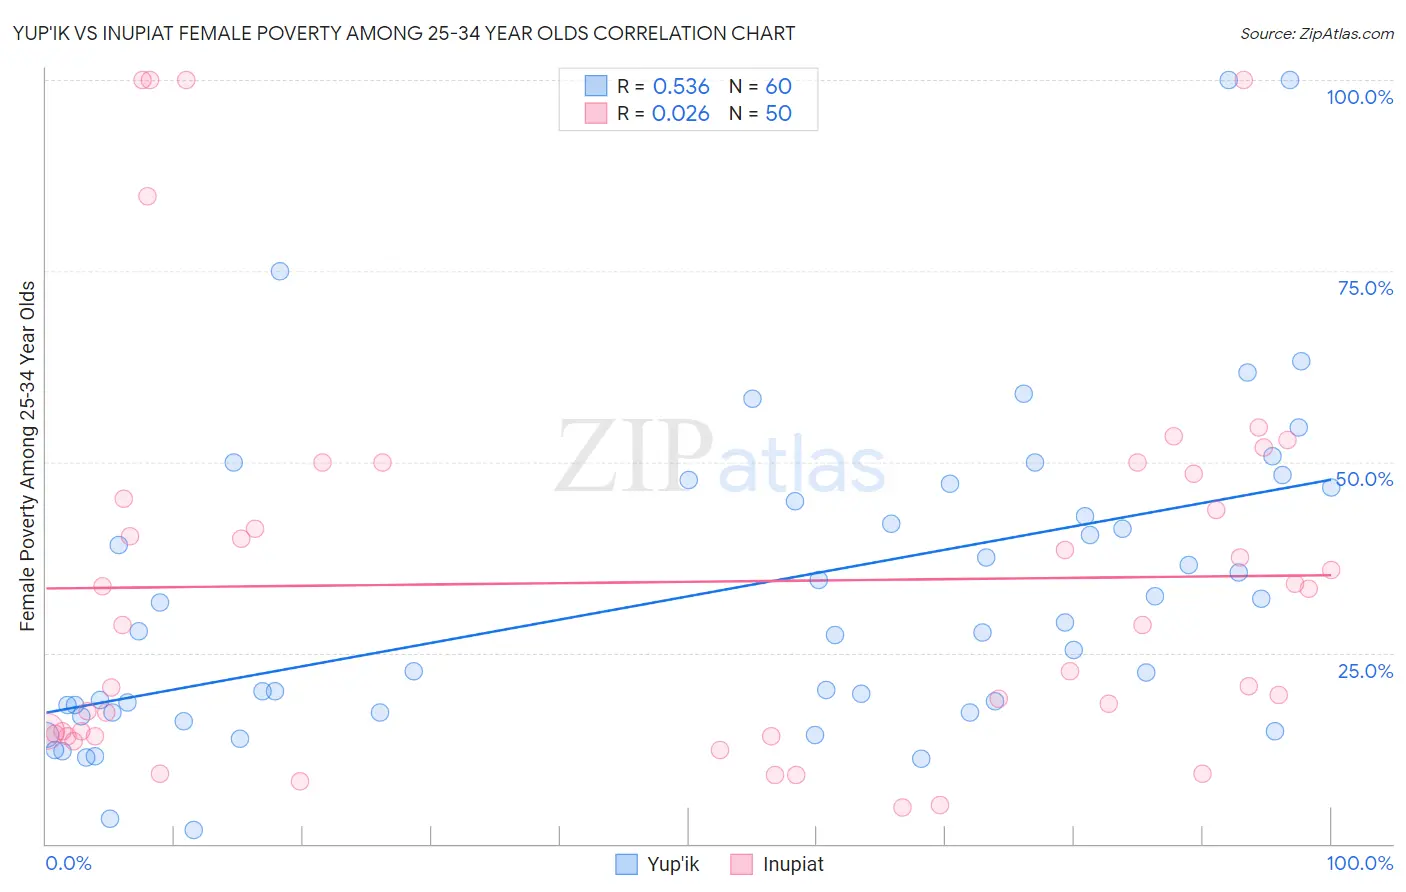
Yup'ik vs Inupiat Female Poverty Among 25-34 Year Olds Correlation Chart
The statistical analysis conducted on geographies consisting of 39,877,637 people shows a substantial positive correlation between the proportion of Yup'ik and poverty level among females between the ages 25 and 34 in the United States with a correlation coefficient (R) of 0.536 and weighted average of 24.3%. Similarly, the statistical analysis conducted on geographies consisting of 95,902,522 people shows no correlation between the proportion of Inupiat and poverty level among females between the ages 25 and 34 in the United States with a correlation coefficient (R) of 0.026 and weighted average of 18.5%, a difference of 31.2%.
Female Poverty Among 25-34 Year Olds Correlation Summary
| Measurement | Yup'ik | Inupiat |
| Minimum | 1.7% | 4.7% |
| Maximum | 100.0% | 100.0% |
| Range | 98.3% | 95.3% |
| Mean | 32.7% | 34.2% |
| Median | 27.7% | 28.6% |
| Interquartile 25% (IQ1) | 17.2% | 14.4% |
| Interquartile 75% (IQ3) | 45.7% | 48.5% |
| Interquartile Range (IQR) | 28.6% | 34.1% |
| Standard Deviation (Sample) | 20.8% | 26.0% |
| Standard Deviation (Population) | 20.6% | 25.7% |
Demographics Similar to Yup'ik and Inupiat by Female Poverty Among 25-34 Year Olds
In terms of female poverty among 25-34 year olds, the demographic groups most similar to Yup'ik are Tohono O'odham (24.7%, a difference of 1.8%), Hopi (23.7%, a difference of 2.7%), Navajo (23.3%, a difference of 4.1%), Sioux (23.0%, a difference of 5.9%), and Yuman (22.9%, a difference of 6.1%). Similarly, the demographic groups most similar to Inupiat are Dutch West Indian (18.4%, a difference of 0.52%), Black/African American (18.9%, a difference of 2.0%), Cheyenne (19.1%, a difference of 3.0%), Alaskan Athabascan (19.1%, a difference of 3.1%), and Creek (19.2%, a difference of 3.4%).
| Demographics | Rating | Rank | Female Poverty Among 25-34 Year Olds |
| Dutch West Indians | 0.0 /100 | #324 | Tragic 18.4% |
| Inupiat | 0.0 /100 | #325 | Tragic 18.5% |
| Blacks/African Americans | 0.0 /100 | #326 | Tragic 18.9% |
| Cheyenne | 0.0 /100 | #327 | Tragic 19.1% |
| Alaskan Athabascans | 0.0 /100 | #328 | Tragic 19.1% |
| Creek | 0.0 /100 | #329 | Tragic 19.2% |
| Paiute | 0.0 /100 | #330 | Tragic 19.6% |
| Kiowa | 0.0 /100 | #331 | Tragic 19.7% |
| Immigrants | Yemen | 0.0 /100 | #332 | Tragic 19.8% |
| Cajuns | 0.0 /100 | #333 | Tragic 19.9% |
| Apache | 0.0 /100 | #334 | Tragic 20.1% |
| Natives/Alaskans | 0.0 /100 | #335 | Tragic 20.3% |
| Pueblo | 0.0 /100 | #336 | Tragic 22.2% |
| Crow | 0.0 /100 | #337 | Tragic 22.7% |
| Houma | 0.0 /100 | #338 | Tragic 22.7% |
| Yuman | 0.0 /100 | #339 | Tragic 22.9% |
| Sioux | 0.0 /100 | #340 | Tragic 23.0% |
| Navajo | 0.0 /100 | #341 | Tragic 23.3% |
| Hopi | 0.0 /100 | #342 | Tragic 23.7% |
| Yup'ik | 0.0 /100 | #343 | Tragic 24.3% |
| Tohono O'odham | 0.0 /100 | #344 | Tragic 24.7% |