Immigrants from Dominica vs Immigrants from Senegal Male Poverty
COMPARE
Immigrants from Dominica
Immigrants from Senegal
Male Poverty
Male Poverty Comparison
Immigrants from Dominica
Immigrants from Senegal
14.7%
MALE POVERTY
0.0/ 100
METRIC RATING
317th/ 347
METRIC RANK
14.0%
MALE POVERTY
0.0/ 100
METRIC RATING
301st/ 347
METRIC RANK
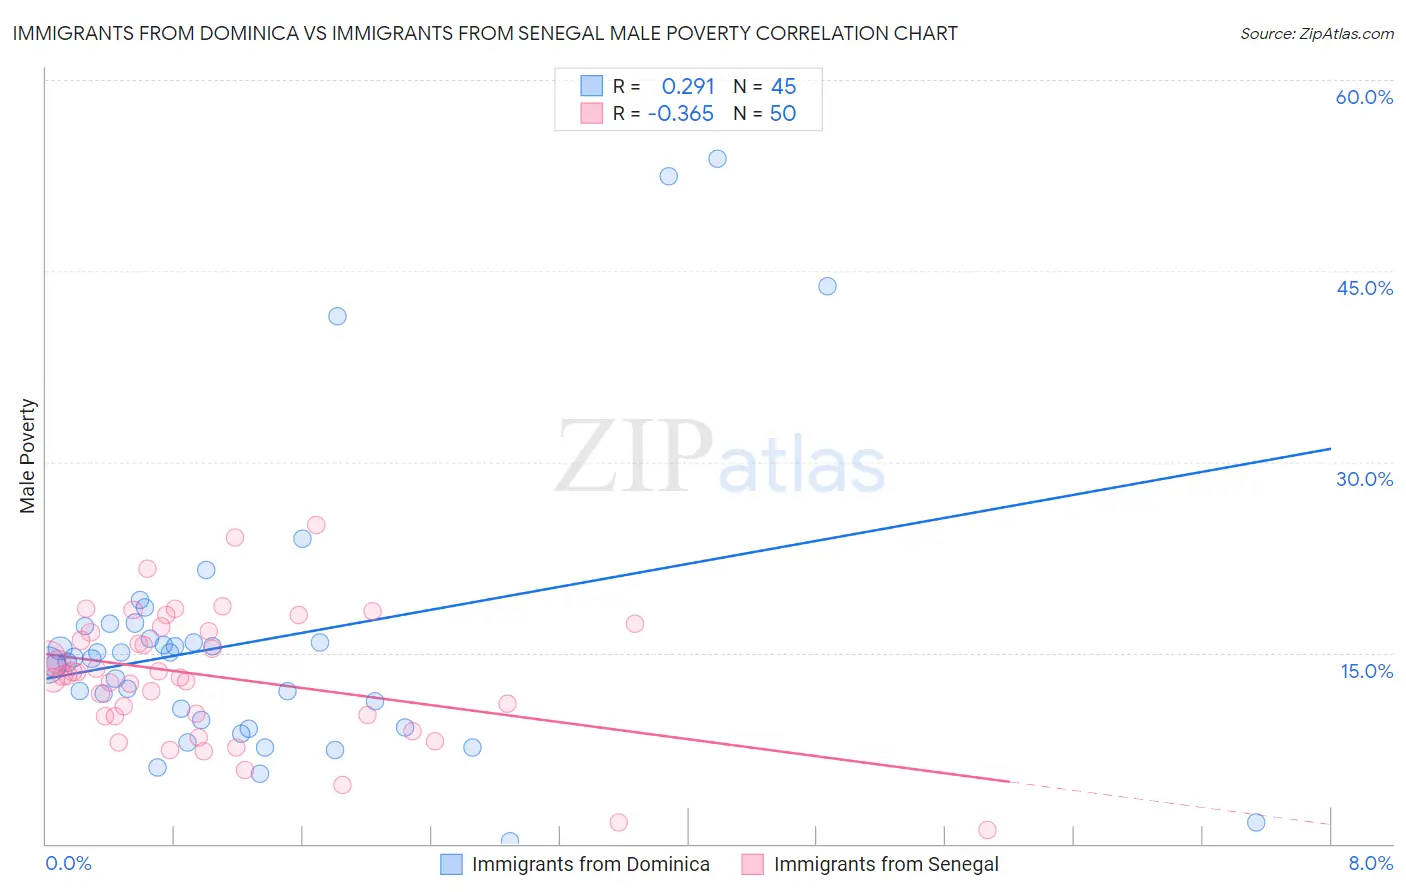
Immigrants from Dominica vs Immigrants from Senegal Male Poverty Correlation Chart
The statistical analysis conducted on geographies consisting of 83,775,975 people shows a weak positive correlation between the proportion of Immigrants from Dominica and poverty level among males in the United States with a correlation coefficient (R) of 0.291 and weighted average of 14.7%. Similarly, the statistical analysis conducted on geographies consisting of 90,120,671 people shows a mild negative correlation between the proportion of Immigrants from Senegal and poverty level among males in the United States with a correlation coefficient (R) of -0.365 and weighted average of 14.0%, a difference of 4.7%.
Male Poverty Correlation Summary
| Measurement | Immigrants from Dominica | Immigrants from Senegal |
| Minimum | 0.21% | 1.1% |
| Maximum | 53.8% | 25.1% |
| Range | 53.6% | 24.0% |
| Mean | 15.9% | 13.1% |
| Median | 14.5% | 13.2% |
| Interquartile 25% (IQ1) | 9.4% | 10.0% |
| Interquartile 75% (IQ3) | 16.6% | 16.7% |
| Interquartile Range (IQR) | 7.2% | 6.7% |
| Standard Deviation (Sample) | 11.3% | 5.1% |
| Standard Deviation (Population) | 11.1% | 5.0% |
Demographics Similar to Immigrants from Dominica and Immigrants from Senegal by Male Poverty
In terms of male poverty, the demographic groups most similar to Immigrants from Dominica are Immigrants from Grenada (14.7%, a difference of 0.060%), U.S. Virgin Islander (14.7%, a difference of 0.090%), British West Indian (14.6%, a difference of 0.68%), Chippewa (14.6%, a difference of 0.70%), and Immigrants from Honduras (14.6%, a difference of 0.78%). Similarly, the demographic groups most similar to Immigrants from Senegal are Immigrants from Caribbean (14.0%, a difference of 0.060%), Immigrants from Mexico (14.0%, a difference of 0.070%), Bahamian (14.1%, a difference of 0.10%), Immigrants from Guatemala (14.0%, a difference of 0.18%), and Senegalese (14.1%, a difference of 0.20%).
| Demographics | Rating | Rank | Male Poverty |
| Immigrants | Guatemala | 0.0 /100 | #299 | Tragic 14.0% |
| Immigrants | Mexico | 0.0 /100 | #300 | Tragic 14.0% |
| Immigrants | Senegal | 0.0 /100 | #301 | Tragic 14.0% |
| Immigrants | Caribbean | 0.0 /100 | #302 | Tragic 14.0% |
| Bahamians | 0.0 /100 | #303 | Tragic 14.1% |
| Senegalese | 0.0 /100 | #304 | Tragic 14.1% |
| Immigrants | Bangladesh | 0.0 /100 | #305 | Tragic 14.1% |
| Creek | 0.0 /100 | #306 | Tragic 14.1% |
| Dutch West Indians | 0.0 /100 | #307 | Tragic 14.2% |
| Africans | 0.0 /100 | #308 | Tragic 14.2% |
| Somalis | 0.0 /100 | #309 | Tragic 14.3% |
| Seminole | 0.0 /100 | #310 | Tragic 14.3% |
| Hondurans | 0.0 /100 | #311 | Tragic 14.3% |
| Choctaw | 0.0 /100 | #312 | Tragic 14.4% |
| Immigrants | Somalia | 0.0 /100 | #313 | Tragic 14.6% |
| Immigrants | Honduras | 0.0 /100 | #314 | Tragic 14.6% |
| Chippewa | 0.0 /100 | #315 | Tragic 14.6% |
| British West Indians | 0.0 /100 | #316 | Tragic 14.6% |
| Immigrants | Dominica | 0.0 /100 | #317 | Tragic 14.7% |
| Immigrants | Grenada | 0.0 /100 | #318 | Tragic 14.7% |
| U.S. Virgin Islanders | 0.0 /100 | #319 | Tragic 14.7% |