Immigrants from Japan vs Afghan Seniors Poverty Over the Age of 65
COMPARE
Immigrants from Japan
Afghan
Seniors Poverty Over the Age of 65
Seniors Poverty Over the Age of 65 Comparison
Immigrants from Japan
Afghans
10.1%
SENIORS POVERTY OVER THE AGE OF 65
96.3/ 100
METRIC RATING
95th/ 347
METRIC RANK
9.8%
SENIORS POVERTY OVER THE AGE OF 65
99.2/ 100
METRIC RATING
55th/ 347
METRIC RANK
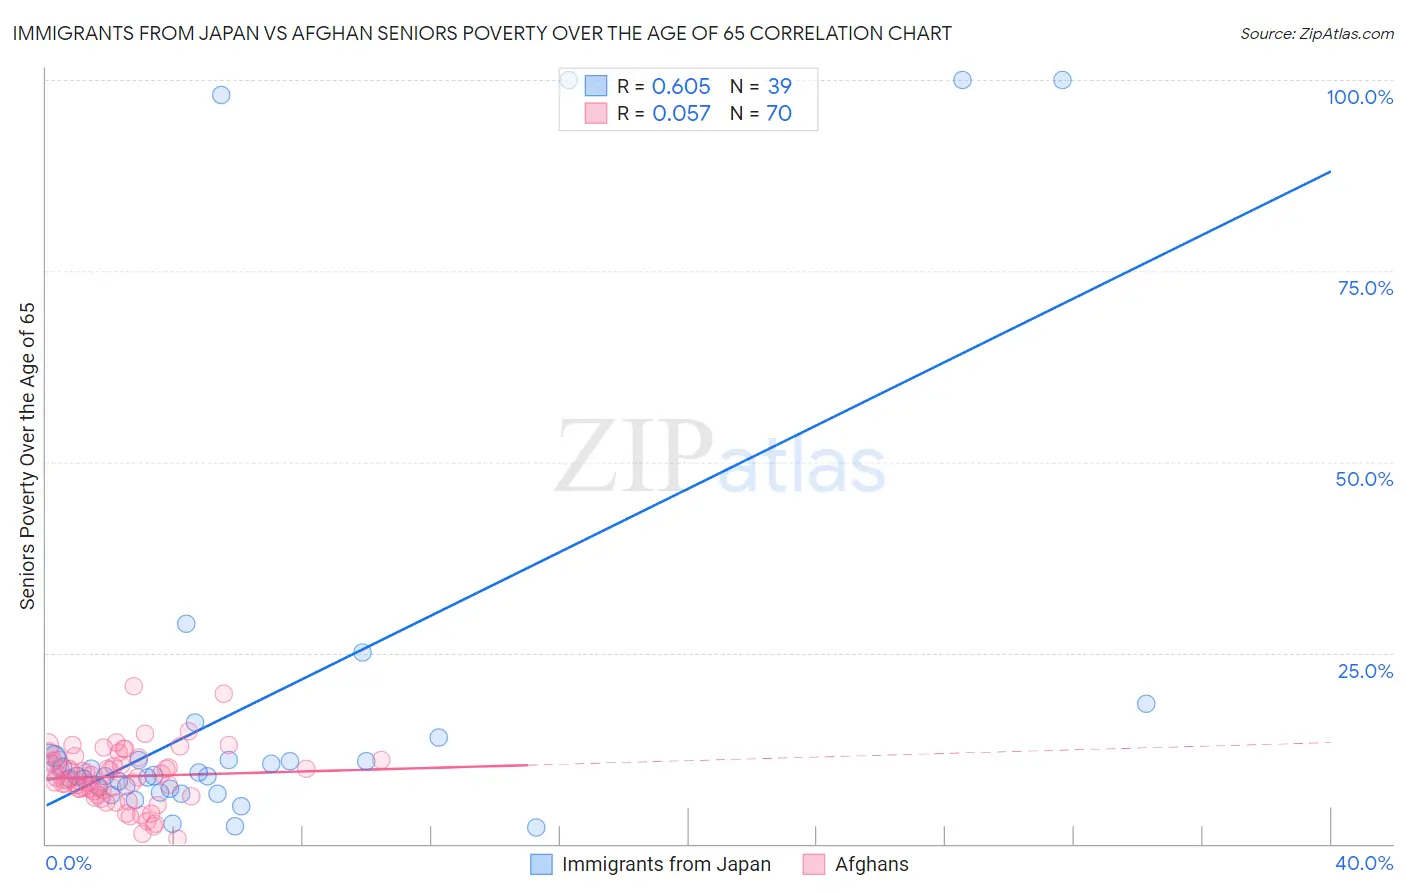
Immigrants from Japan vs Afghan Seniors Poverty Over the Age of 65 Correlation Chart
The statistical analysis conducted on geographies consisting of 339,182,731 people shows a significant positive correlation between the proportion of Immigrants from Japan and poverty level among seniors over the age of 65 in the United States with a correlation coefficient (R) of 0.605 and weighted average of 10.1%. Similarly, the statistical analysis conducted on geographies consisting of 148,656,198 people shows a slight positive correlation between the proportion of Afghans and poverty level among seniors over the age of 65 in the United States with a correlation coefficient (R) of 0.057 and weighted average of 9.8%, a difference of 3.7%.
Seniors Poverty Over the Age of 65 Correlation Summary
| Measurement | Immigrants from Japan | Afghan |
| Minimum | 2.1% | 0.71% |
| Maximum | 100.0% | 20.6% |
| Range | 97.9% | 19.9% |
| Mean | 19.0% | 8.8% |
| Median | 8.9% | 8.7% |
| Interquartile 25% (IQ1) | 7.2% | 6.8% |
| Interquartile 75% (IQ3) | 11.5% | 11.0% |
| Interquartile Range (IQR) | 4.2% | 4.2% |
| Standard Deviation (Sample) | 28.0% | 3.7% |
| Standard Deviation (Population) | 27.7% | 3.7% |
Similar Demographics by Seniors Poverty Over the Age of 65
Demographics Similar to Immigrants from Japan by Seniors Poverty Over the Age of 65
In terms of seniors poverty over the age of 65, the demographic groups most similar to Immigrants from Japan are Immigrants from Germany (10.1%, a difference of 0.23%), Basque (10.2%, a difference of 0.28%), Immigrants from Sweden (10.1%, a difference of 0.30%), Immigrants from Pakistan (10.2%, a difference of 0.37%), and Immigrants from Singapore (10.1%, a difference of 0.41%).
| Demographics | Rating | Rank | Seniors Poverty Over the Age of 65 |
| Jordanians | 97.1 /100 | #88 | Exceptional 10.1% |
| Immigrants | Bulgaria | 97.0 /100 | #89 | Exceptional 10.1% |
| Ukrainians | 96.9 /100 | #90 | Exceptional 10.1% |
| Puget Sound Salish | 96.9 /100 | #91 | Exceptional 10.1% |
| Immigrants | Singapore | 96.9 /100 | #92 | Exceptional 10.1% |
| Immigrants | Sweden | 96.7 /100 | #93 | Exceptional 10.1% |
| Immigrants | Germany | 96.7 /100 | #94 | Exceptional 10.1% |
| Immigrants | Japan | 96.3 /100 | #95 | Exceptional 10.1% |
| Basques | 95.9 /100 | #96 | Exceptional 10.2% |
| Immigrants | Pakistan | 95.7 /100 | #97 | Exceptional 10.2% |
| Immigrants | Kuwait | 95.5 /100 | #98 | Exceptional 10.2% |
| Cypriots | 95.5 /100 | #99 | Exceptional 10.2% |
| Marshallese | 95.3 /100 | #100 | Exceptional 10.2% |
| Immigrants | Jordan | 94.7 /100 | #101 | Exceptional 10.2% |
| Delaware | 94.5 /100 | #102 | Exceptional 10.2% |
Demographics Similar to Afghans by Seniors Poverty Over the Age of 65
In terms of seniors poverty over the age of 65, the demographic groups most similar to Afghans are Immigrants from England (9.8%, a difference of 0.12%), Immigrants from Northern Europe (9.8%, a difference of 0.13%), Slavic (9.8%, a difference of 0.19%), Bolivian (9.8%, a difference of 0.24%), and Filipino (9.7%, a difference of 0.29%).
| Demographics | Rating | Rank | Seniors Poverty Over the Age of 65 |
| French | 99.5 /100 | #48 | Exceptional 9.7% |
| Immigrants | Lithuania | 99.4 /100 | #49 | Exceptional 9.7% |
| Hungarians | 99.4 /100 | #50 | Exceptional 9.7% |
| Carpatho Rusyns | 99.3 /100 | #51 | Exceptional 9.7% |
| Filipinos | 99.3 /100 | #52 | Exceptional 9.7% |
| Slavs | 99.2 /100 | #53 | Exceptional 9.8% |
| Immigrants | Northern Europe | 99.2 /100 | #54 | Exceptional 9.8% |
| Afghans | 99.2 /100 | #55 | Exceptional 9.8% |
| Immigrants | England | 99.1 /100 | #56 | Exceptional 9.8% |
| Bolivians | 99.1 /100 | #57 | Exceptional 9.8% |
| Serbians | 99.1 /100 | #58 | Exceptional 9.8% |
| Immigrants | Canada | 99.0 /100 | #59 | Exceptional 9.8% |
| Celtics | 99.0 /100 | #60 | Exceptional 9.8% |
| Iranians | 98.9 /100 | #61 | Exceptional 9.8% |
| French Canadians | 98.9 /100 | #62 | Exceptional 9.8% |