Nigerian vs Afghan Seniors Poverty Over the Age of 65
COMPARE
Nigerian
Afghan
Seniors Poverty Over the Age of 65
Seniors Poverty Over the Age of 65 Comparison
Nigerians
Afghans
11.8%
SENIORS POVERTY OVER THE AGE OF 65
3.2/ 100
METRIC RATING
227th/ 347
METRIC RANK
9.8%
SENIORS POVERTY OVER THE AGE OF 65
99.2/ 100
METRIC RATING
55th/ 347
METRIC RANK
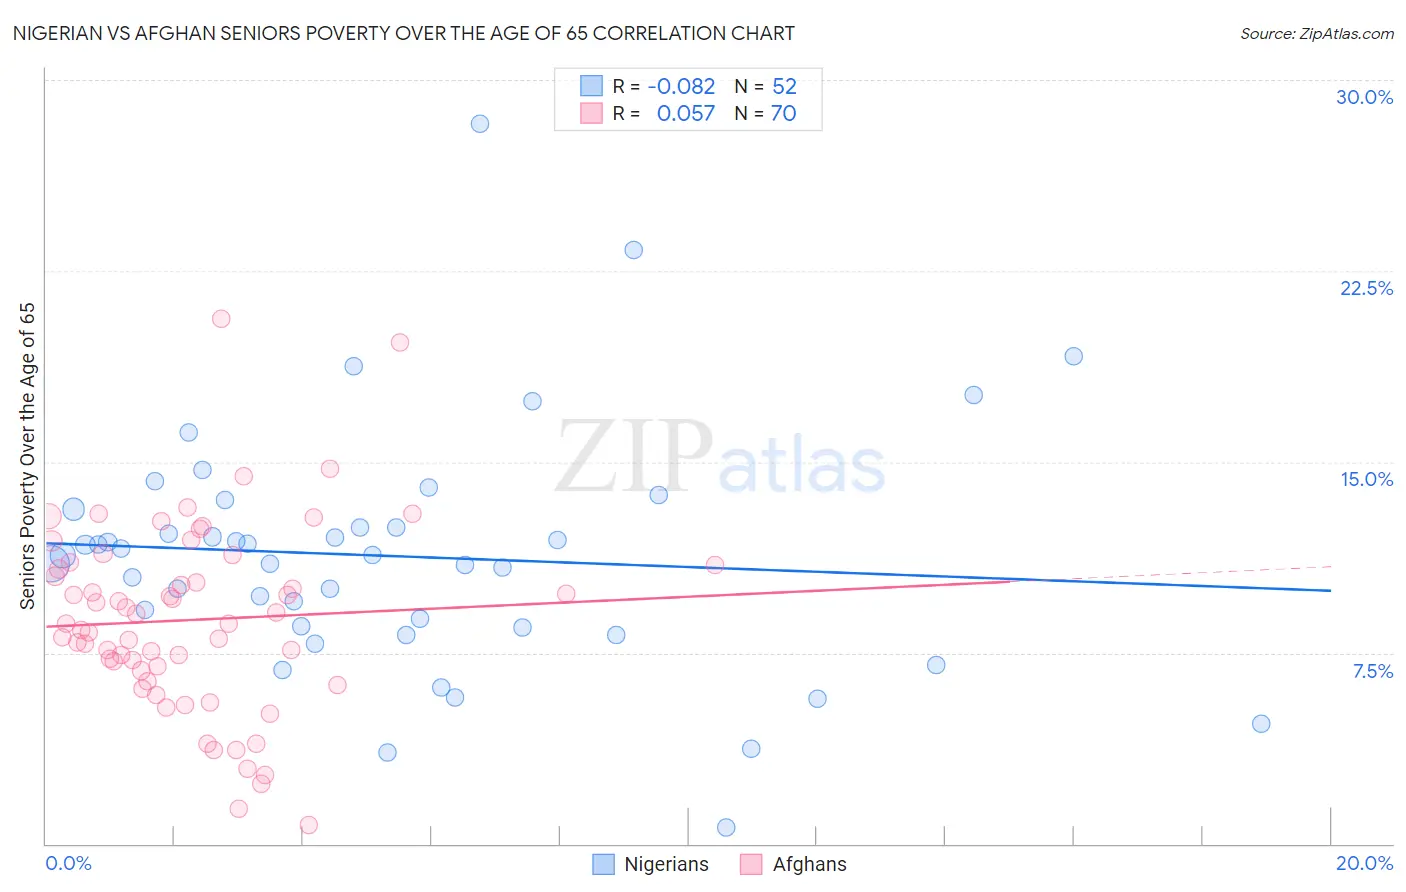
Nigerian vs Afghan Seniors Poverty Over the Age of 65 Correlation Chart
The statistical analysis conducted on geographies consisting of 331,610,759 people shows a slight negative correlation between the proportion of Nigerians and poverty level among seniors over the age of 65 in the United States with a correlation coefficient (R) of -0.082 and weighted average of 11.8%. Similarly, the statistical analysis conducted on geographies consisting of 148,656,198 people shows a slight positive correlation between the proportion of Afghans and poverty level among seniors over the age of 65 in the United States with a correlation coefficient (R) of 0.057 and weighted average of 9.8%, a difference of 20.4%.
Seniors Poverty Over the Age of 65 Correlation Summary
| Measurement | Nigerian | Afghan |
| Minimum | 0.63% | 0.71% |
| Maximum | 28.3% | 20.6% |
| Range | 27.7% | 19.9% |
| Mean | 11.3% | 8.8% |
| Median | 11.3% | 8.7% |
| Interquartile 25% (IQ1) | 8.5% | 6.8% |
| Interquartile 75% (IQ3) | 12.8% | 11.0% |
| Interquartile Range (IQR) | 4.3% | 4.2% |
| Standard Deviation (Sample) | 4.8% | 3.7% |
| Standard Deviation (Population) | 4.7% | 3.7% |
Similar Demographics by Seniors Poverty Over the Age of 65
Demographics Similar to Nigerians by Seniors Poverty Over the Age of 65
In terms of seniors poverty over the age of 65, the demographic groups most similar to Nigerians are Liberian (11.8%, a difference of 0.030%), Immigrants from Belarus (11.8%, a difference of 0.060%), Immigrants from Nigeria (11.7%, a difference of 0.16%), Immigrants from Costa Rica (11.8%, a difference of 0.33%), and Immigrants from Congo (11.7%, a difference of 0.39%).
| Demographics | Rating | Rank | Seniors Poverty Over the Age of 65 |
| Peruvians | 4.2 /100 | #220 | Tragic 11.7% |
| Argentineans | 4.1 /100 | #221 | Tragic 11.7% |
| Immigrants | Chile | 3.9 /100 | #222 | Tragic 11.7% |
| Immigrants | Congo | 3.8 /100 | #223 | Tragic 11.7% |
| Immigrants | Nigeria | 3.4 /100 | #224 | Tragic 11.7% |
| Immigrants | Belarus | 3.2 /100 | #225 | Tragic 11.8% |
| Liberians | 3.2 /100 | #226 | Tragic 11.8% |
| Nigerians | 3.2 /100 | #227 | Tragic 11.8% |
| Immigrants | Costa Rica | 2.7 /100 | #228 | Tragic 11.8% |
| Immigrants | Eritrea | 2.6 /100 | #229 | Tragic 11.8% |
| Bermudans | 2.1 /100 | #230 | Tragic 11.9% |
| Cajuns | 2.0 /100 | #231 | Tragic 11.9% |
| Yaqui | 1.9 /100 | #232 | Tragic 11.9% |
| Panamanians | 1.8 /100 | #233 | Tragic 11.9% |
| Iroquois | 1.7 /100 | #234 | Tragic 11.9% |
Demographics Similar to Afghans by Seniors Poverty Over the Age of 65
In terms of seniors poverty over the age of 65, the demographic groups most similar to Afghans are Immigrants from England (9.8%, a difference of 0.12%), Immigrants from Northern Europe (9.8%, a difference of 0.13%), Slavic (9.8%, a difference of 0.19%), Bolivian (9.8%, a difference of 0.24%), and Filipino (9.7%, a difference of 0.29%).
| Demographics | Rating | Rank | Seniors Poverty Over the Age of 65 |
| French | 99.5 /100 | #48 | Exceptional 9.7% |
| Immigrants | Lithuania | 99.4 /100 | #49 | Exceptional 9.7% |
| Hungarians | 99.4 /100 | #50 | Exceptional 9.7% |
| Carpatho Rusyns | 99.3 /100 | #51 | Exceptional 9.7% |
| Filipinos | 99.3 /100 | #52 | Exceptional 9.7% |
| Slavs | 99.2 /100 | #53 | Exceptional 9.8% |
| Immigrants | Northern Europe | 99.2 /100 | #54 | Exceptional 9.8% |
| Afghans | 99.2 /100 | #55 | Exceptional 9.8% |
| Immigrants | England | 99.1 /100 | #56 | Exceptional 9.8% |
| Bolivians | 99.1 /100 | #57 | Exceptional 9.8% |
| Serbians | 99.1 /100 | #58 | Exceptional 9.8% |
| Immigrants | Canada | 99.0 /100 | #59 | Exceptional 9.8% |
| Celtics | 99.0 /100 | #60 | Exceptional 9.8% |
| Iranians | 98.9 /100 | #61 | Exceptional 9.8% |
| French Canadians | 98.9 /100 | #62 | Exceptional 9.8% |