Assyrian/Chaldean/Syriac vs Afghan Seniors Poverty Over the Age of 65
COMPARE
Assyrian/Chaldean/Syriac
Afghan
Seniors Poverty Over the Age of 65
Seniors Poverty Over the Age of 65 Comparison
Assyrians/Chaldeans/Syriacs
Afghans
9.6%
SENIORS POVERTY OVER THE AGE OF 65
99.6/ 100
METRIC RATING
40th/ 347
METRIC RANK
9.8%
SENIORS POVERTY OVER THE AGE OF 65
99.2/ 100
METRIC RATING
55th/ 347
METRIC RANK
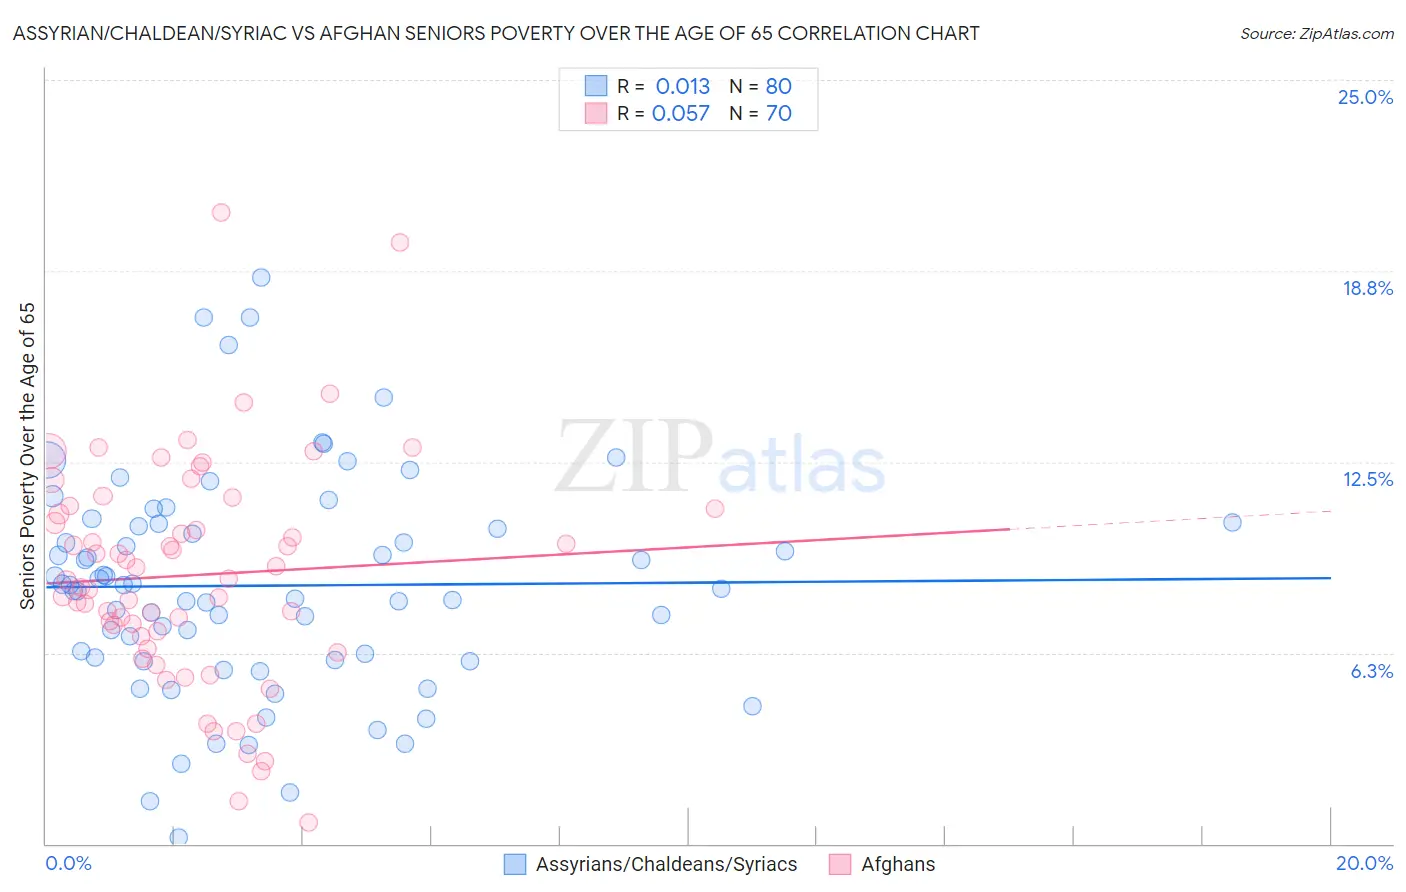
Assyrian/Chaldean/Syriac vs Afghan Seniors Poverty Over the Age of 65 Correlation Chart
The statistical analysis conducted on geographies consisting of 110,236,385 people shows no correlation between the proportion of Assyrians/Chaldeans/Syriacs and poverty level among seniors over the age of 65 in the United States with a correlation coefficient (R) of 0.013 and weighted average of 9.6%. Similarly, the statistical analysis conducted on geographies consisting of 148,656,198 people shows a slight positive correlation between the proportion of Afghans and poverty level among seniors over the age of 65 in the United States with a correlation coefficient (R) of 0.057 and weighted average of 9.8%, a difference of 2.1%.
Seniors Poverty Over the Age of 65 Correlation Summary
| Measurement | Assyrian/Chaldean/Syriac | Afghan |
| Minimum | 0.19% | 0.71% |
| Maximum | 18.5% | 20.6% |
| Range | 18.3% | 19.9% |
| Mean | 8.4% | 8.8% |
| Median | 8.4% | 8.7% |
| Interquartile 25% (IQ1) | 6.1% | 6.8% |
| Interquartile 75% (IQ3) | 10.4% | 11.0% |
| Interquartile Range (IQR) | 4.4% | 4.2% |
| Standard Deviation (Sample) | 3.6% | 3.7% |
| Standard Deviation (Population) | 3.6% | 3.7% |
Demographics Similar to Assyrians/Chaldeans/Syriacs and Afghans by Seniors Poverty Over the Age of 65
In terms of seniors poverty over the age of 65, the demographic groups most similar to Assyrians/Chaldeans/Syriacs are Greek (9.6%, a difference of 0.12%), Immigrants from North Macedonia (9.6%, a difference of 0.16%), Zimbabwean (9.6%, a difference of 0.32%), Eastern European (9.6%, a difference of 0.42%), and Austrian (9.6%, a difference of 0.51%). Similarly, the demographic groups most similar to Afghans are Immigrants from England (9.8%, a difference of 0.12%), Immigrants from Northern Europe (9.8%, a difference of 0.13%), Slavic (9.8%, a difference of 0.19%), Bolivian (9.8%, a difference of 0.24%), and Filipino (9.7%, a difference of 0.29%).
| Demographics | Rating | Rank | Seniors Poverty Over the Age of 65 |
| Scotch-Irish | 99.7 /100 | #37 | Exceptional 9.5% |
| Belgians | 99.7 /100 | #38 | Exceptional 9.5% |
| Greeks | 99.6 /100 | #39 | Exceptional 9.6% |
| Assyrians/Chaldeans/Syriacs | 99.6 /100 | #40 | Exceptional 9.6% |
| Immigrants | North Macedonia | 99.6 /100 | #41 | Exceptional 9.6% |
| Zimbabweans | 99.6 /100 | #42 | Exceptional 9.6% |
| Eastern Europeans | 99.6 /100 | #43 | Exceptional 9.6% |
| Austrians | 99.5 /100 | #44 | Exceptional 9.6% |
| Estonians | 99.5 /100 | #45 | Exceptional 9.6% |
| Immigrants | Taiwan | 99.5 /100 | #46 | Exceptional 9.7% |
| Immigrants | South Central Asia | 99.5 /100 | #47 | Exceptional 9.7% |
| French | 99.5 /100 | #48 | Exceptional 9.7% |
| Immigrants | Lithuania | 99.4 /100 | #49 | Exceptional 9.7% |
| Hungarians | 99.4 /100 | #50 | Exceptional 9.7% |
| Carpatho Rusyns | 99.3 /100 | #51 | Exceptional 9.7% |
| Filipinos | 99.3 /100 | #52 | Exceptional 9.7% |
| Slavs | 99.2 /100 | #53 | Exceptional 9.8% |
| Immigrants | Northern Europe | 99.2 /100 | #54 | Exceptional 9.8% |
| Afghans | 99.2 /100 | #55 | Exceptional 9.8% |
| Immigrants | England | 99.1 /100 | #56 | Exceptional 9.8% |
| Bolivians | 99.1 /100 | #57 | Exceptional 9.8% |