Immigrants from Japan vs Afghan Householder Income Ages 45 - 64 years
COMPARE
Immigrants from Japan
Afghan
Householder Income Ages 45 - 64 years
Householder Income Ages 45 - 64 years Comparison
Immigrants from Japan
Afghans
$118,498
HOUSEHOLDER INCOME AGES 45 - 64 YEARS
100.0/ 100
METRIC RATING
24th/ 347
METRIC RANK
$112,676
HOUSEHOLDER INCOME AGES 45 - 64 YEARS
99.8/ 100
METRIC RATING
53rd/ 347
METRIC RANK
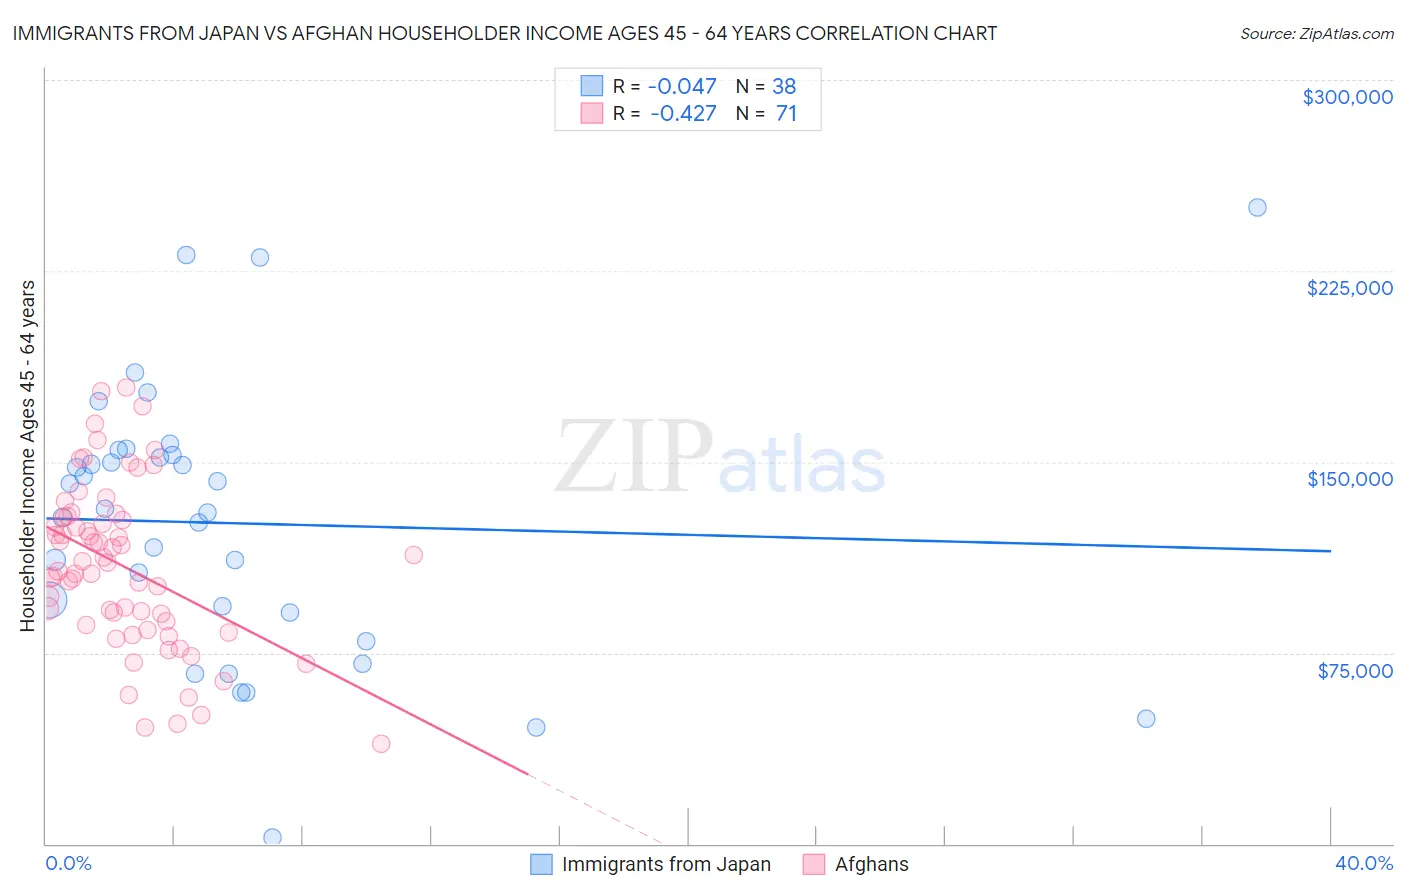
Immigrants from Japan vs Afghan Householder Income Ages 45 - 64 years Correlation Chart
The statistical analysis conducted on geographies consisting of 339,668,461 people shows no correlation between the proportion of Immigrants from Japan and household income with householder between the ages 45 and 64 in the United States with a correlation coefficient (R) of -0.047 and weighted average of $118,498. Similarly, the statistical analysis conducted on geographies consisting of 148,795,333 people shows a moderate negative correlation between the proportion of Afghans and household income with householder between the ages 45 and 64 in the United States with a correlation coefficient (R) of -0.427 and weighted average of $112,676, a difference of 5.2%.
Householder Income Ages 45 - 64 years Correlation Summary
| Measurement | Immigrants from Japan | Afghan |
| Minimum | $2,499 | $39,280 |
| Maximum | $250,001 | $179,167 |
| Range | $247,502 | $139,887 |
| Mean | $125,900 | $108,848 |
| Median | $130,922 | $110,488 |
| Interquartile 25% (IQ1) | $90,857 | $85,959 |
| Interquartile 75% (IQ3) | $152,701 | $128,039 |
| Interquartile Range (IQR) | $61,844 | $42,080 |
| Standard Deviation (Sample) | $53,396 | $32,099 |
| Standard Deviation (Population) | $52,689 | $31,872 |
Similar Demographics by Householder Income Ages 45 - 64 years
Demographics Similar to Immigrants from Japan by Householder Income Ages 45 - 64 years
In terms of householder income ages 45 - 64 years, the demographic groups most similar to Immigrants from Japan are Asian ($118,426, a difference of 0.060%), Immigrants from Sweden ($118,318, a difference of 0.15%), Bolivian ($118,871, a difference of 0.32%), Immigrants from Belgium ($118,932, a difference of 0.37%), and Immigrants from Northern Europe ($117,930, a difference of 0.48%).
| Demographics | Rating | Rank | Householder Income Ages 45 - 64 years |
| Burmese | 100.0 /100 | #17 | Exceptional $121,444 |
| Immigrants | Korea | 100.0 /100 | #18 | Exceptional $121,243 |
| Eastern Europeans | 100.0 /100 | #19 | Exceptional $120,684 |
| Immigrants | Australia | 100.0 /100 | #20 | Exceptional $119,308 |
| Immigrants | Sri Lanka | 100.0 /100 | #21 | Exceptional $119,094 |
| Immigrants | Belgium | 100.0 /100 | #22 | Exceptional $118,932 |
| Bolivians | 100.0 /100 | #23 | Exceptional $118,871 |
| Immigrants | Japan | 100.0 /100 | #24 | Exceptional $118,498 |
| Asians | 100.0 /100 | #25 | Exceptional $118,426 |
| Immigrants | Sweden | 100.0 /100 | #26 | Exceptional $118,318 |
| Immigrants | Northern Europe | 100.0 /100 | #27 | Exceptional $117,930 |
| Turks | 100.0 /100 | #28 | Exceptional $117,814 |
| Bhutanese | 100.0 /100 | #29 | Exceptional $117,750 |
| Immigrants | Bolivia | 100.0 /100 | #30 | Exceptional $117,731 |
| Immigrants | Asia | 100.0 /100 | #31 | Exceptional $116,566 |
Demographics Similar to Afghans by Householder Income Ages 45 - 64 years
In terms of householder income ages 45 - 64 years, the demographic groups most similar to Afghans are Greek ($112,630, a difference of 0.040%), Immigrants from Malaysia ($112,796, a difference of 0.11%), Lithuanian ($112,484, a difference of 0.17%), Immigrants from South Africa ($112,886, a difference of 0.19%), and Egyptian ($112,256, a difference of 0.37%).
| Demographics | Rating | Rank | Householder Income Ages 45 - 64 years |
| Immigrants | Greece | 99.9 /100 | #46 | Exceptional $113,548 |
| Australians | 99.9 /100 | #47 | Exceptional $113,533 |
| Immigrants | Indonesia | 99.9 /100 | #48 | Exceptional $113,519 |
| Immigrants | Russia | 99.8 /100 | #49 | Exceptional $113,215 |
| Immigrants | Austria | 99.8 /100 | #50 | Exceptional $113,140 |
| Immigrants | South Africa | 99.8 /100 | #51 | Exceptional $112,886 |
| Immigrants | Malaysia | 99.8 /100 | #52 | Exceptional $112,796 |
| Afghans | 99.8 /100 | #53 | Exceptional $112,676 |
| Greeks | 99.8 /100 | #54 | Exceptional $112,630 |
| Lithuanians | 99.8 /100 | #55 | Exceptional $112,484 |
| Egyptians | 99.7 /100 | #56 | Exceptional $112,256 |
| Immigrants | Scotland | 99.7 /100 | #57 | Exceptional $112,175 |
| Soviet Union | 99.7 /100 | #58 | Exceptional $112,008 |
| Immigrants | Europe | 99.7 /100 | #59 | Exceptional $111,984 |
| Immigrants | Netherlands | 99.7 /100 | #60 | Exceptional $111,982 |