Immigrants from Japan vs Pueblo Seniors Poverty Over the Age of 65
COMPARE
Immigrants from Japan
Pueblo
Seniors Poverty Over the Age of 65
Seniors Poverty Over the Age of 65 Comparison
Immigrants from Japan
Pueblo
10.1%
SENIORS POVERTY OVER THE AGE OF 65
96.3/ 100
METRIC RATING
95th/ 347
METRIC RANK
17.2%
SENIORS POVERTY OVER THE AGE OF 65
0.0/ 100
METRIC RATING
338th/ 347
METRIC RANK
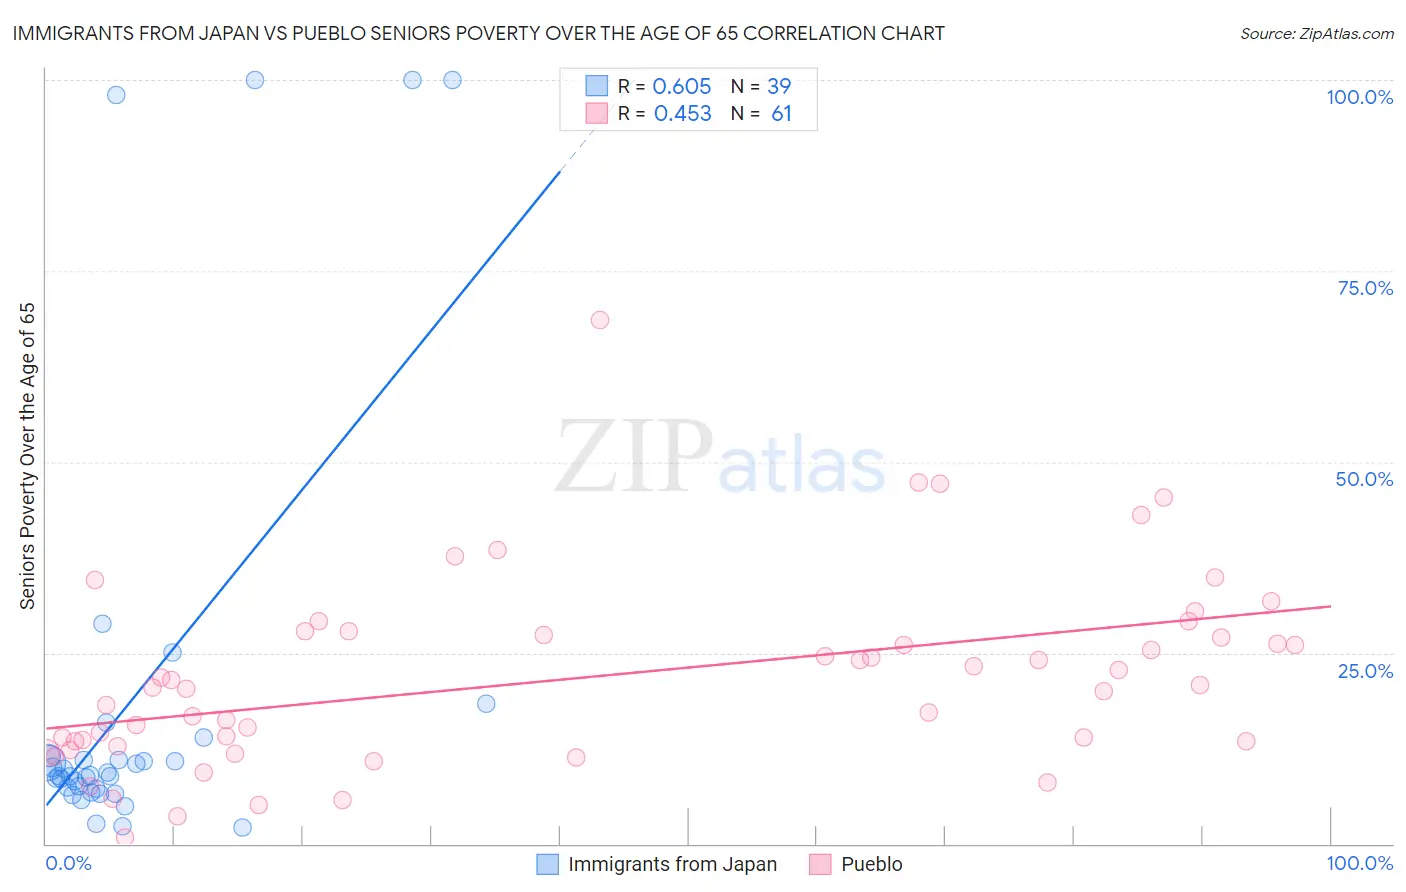
Immigrants from Japan vs Pueblo Seniors Poverty Over the Age of 65 Correlation Chart
The statistical analysis conducted on geographies consisting of 339,182,731 people shows a significant positive correlation between the proportion of Immigrants from Japan and poverty level among seniors over the age of 65 in the United States with a correlation coefficient (R) of 0.605 and weighted average of 10.1%. Similarly, the statistical analysis conducted on geographies consisting of 119,913,001 people shows a moderate positive correlation between the proportion of Pueblo and poverty level among seniors over the age of 65 in the United States with a correlation coefficient (R) of 0.453 and weighted average of 17.2%, a difference of 69.5%.
Seniors Poverty Over the Age of 65 Correlation Summary
| Measurement | Immigrants from Japan | Pueblo |
| Minimum | 2.1% | 0.88% |
| Maximum | 100.0% | 68.6% |
| Range | 97.9% | 67.8% |
| Mean | 19.0% | 21.7% |
| Median | 8.9% | 20.4% |
| Interquartile 25% (IQ1) | 7.2% | 13.0% |
| Interquartile 75% (IQ3) | 11.5% | 27.6% |
| Interquartile Range (IQR) | 4.2% | 14.6% |
| Standard Deviation (Sample) | 28.0% | 12.5% |
| Standard Deviation (Population) | 27.7% | 12.4% |
Similar Demographics by Seniors Poverty Over the Age of 65
Demographics Similar to Immigrants from Japan by Seniors Poverty Over the Age of 65
In terms of seniors poverty over the age of 65, the demographic groups most similar to Immigrants from Japan are Immigrants from Germany (10.1%, a difference of 0.23%), Basque (10.2%, a difference of 0.28%), Immigrants from Sweden (10.1%, a difference of 0.30%), Immigrants from Pakistan (10.2%, a difference of 0.37%), and Immigrants from Singapore (10.1%, a difference of 0.41%).
| Demographics | Rating | Rank | Seniors Poverty Over the Age of 65 |
| Jordanians | 97.1 /100 | #88 | Exceptional 10.1% |
| Immigrants | Bulgaria | 97.0 /100 | #89 | Exceptional 10.1% |
| Ukrainians | 96.9 /100 | #90 | Exceptional 10.1% |
| Puget Sound Salish | 96.9 /100 | #91 | Exceptional 10.1% |
| Immigrants | Singapore | 96.9 /100 | #92 | Exceptional 10.1% |
| Immigrants | Sweden | 96.7 /100 | #93 | Exceptional 10.1% |
| Immigrants | Germany | 96.7 /100 | #94 | Exceptional 10.1% |
| Immigrants | Japan | 96.3 /100 | #95 | Exceptional 10.1% |
| Basques | 95.9 /100 | #96 | Exceptional 10.2% |
| Immigrants | Pakistan | 95.7 /100 | #97 | Exceptional 10.2% |
| Immigrants | Kuwait | 95.5 /100 | #98 | Exceptional 10.2% |
| Cypriots | 95.5 /100 | #99 | Exceptional 10.2% |
| Marshallese | 95.3 /100 | #100 | Exceptional 10.2% |
| Immigrants | Jordan | 94.7 /100 | #101 | Exceptional 10.2% |
| Delaware | 94.5 /100 | #102 | Exceptional 10.2% |
Demographics Similar to Pueblo by Seniors Poverty Over the Age of 65
In terms of seniors poverty over the age of 65, the demographic groups most similar to Pueblo are Navajo (17.5%, a difference of 1.5%), Hopi (17.8%, a difference of 3.5%), Dominican (17.8%, a difference of 3.9%), Immigrants from Caribbean (16.5%, a difference of 4.2%), and Immigrants from Cuba (17.9%, a difference of 4.4%).
| Demographics | Rating | Rank | Seniors Poverty Over the Age of 65 |
| British West Indians | 0.0 /100 | #331 | Tragic 15.6% |
| Immigrants | Grenada | 0.0 /100 | #332 | Tragic 15.8% |
| Immigrants | Yemen | 0.0 /100 | #333 | Tragic 15.9% |
| Immigrants | Nicaragua | 0.0 /100 | #334 | Tragic 15.9% |
| Cubans | 0.0 /100 | #335 | Tragic 16.1% |
| Immigrants | Cabo Verde | 0.0 /100 | #336 | Tragic 16.2% |
| Immigrants | Caribbean | 0.0 /100 | #337 | Tragic 16.5% |
| Pueblo | 0.0 /100 | #338 | Tragic 17.2% |
| Navajo | 0.0 /100 | #339 | Tragic 17.5% |
| Hopi | 0.0 /100 | #340 | Tragic 17.8% |
| Dominicans | 0.0 /100 | #341 | Tragic 17.8% |
| Immigrants | Cuba | 0.0 /100 | #342 | Tragic 17.9% |
| Lumbee | 0.0 /100 | #343 | Tragic 18.1% |
| Immigrants | Dominican Republic | 0.0 /100 | #344 | Tragic 18.3% |
| Pima | 0.0 /100 | #345 | Tragic 19.8% |