Russian vs Afghan Seniors Poverty Over the Age of 65
COMPARE
Russian
Afghan
Seniors Poverty Over the Age of 65
Seniors Poverty Over the Age of 65 Comparison
Russians
Afghans
10.0%
SENIORS POVERTY OVER THE AGE OF 65
97.9/ 100
METRIC RATING
73rd/ 347
METRIC RANK
9.8%
SENIORS POVERTY OVER THE AGE OF 65
99.2/ 100
METRIC RATING
55th/ 347
METRIC RANK
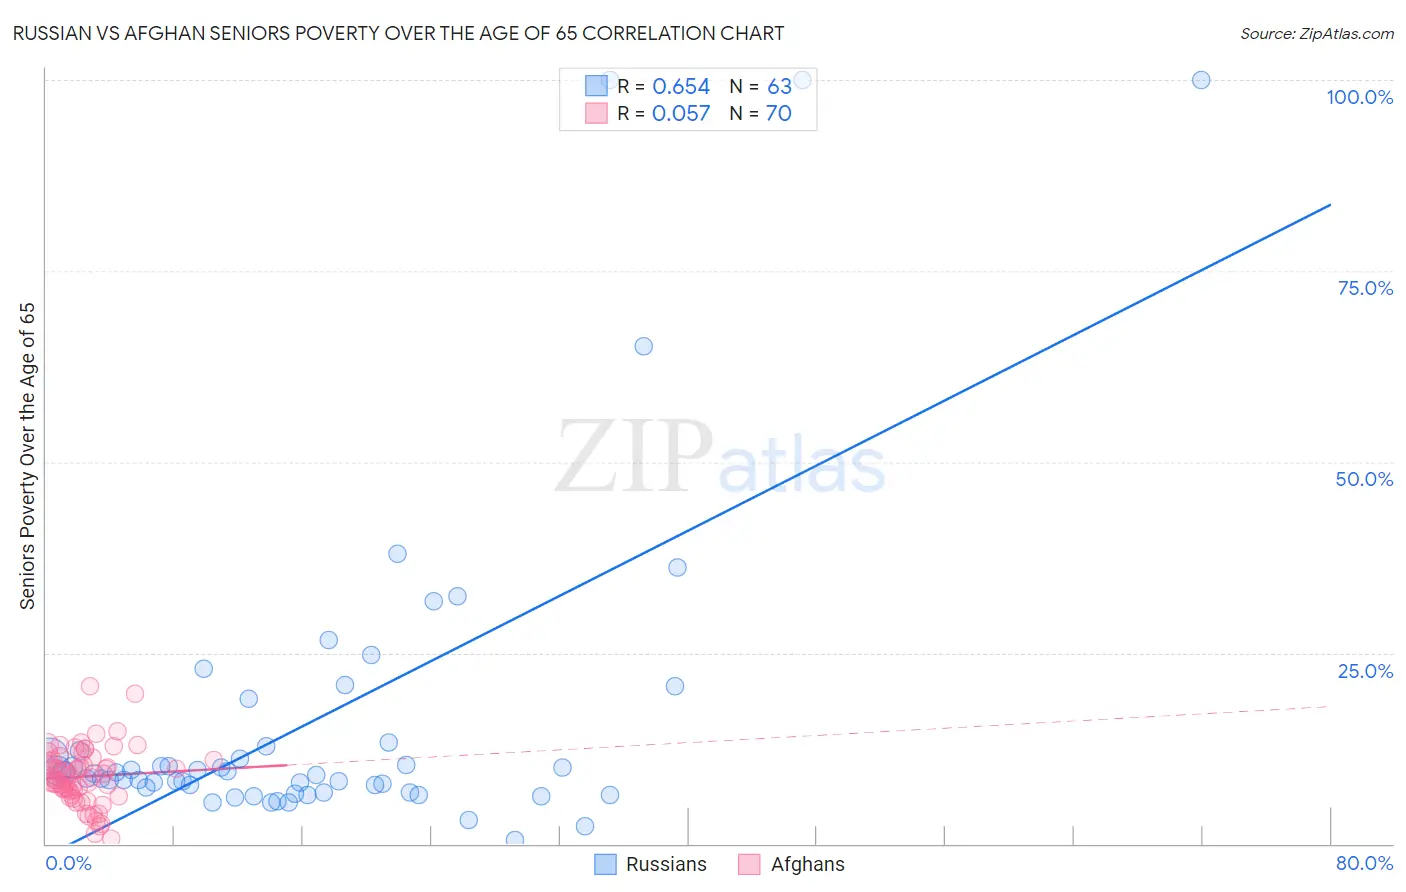
Russian vs Afghan Seniors Poverty Over the Age of 65 Correlation Chart
The statistical analysis conducted on geographies consisting of 508,778,613 people shows a significant positive correlation between the proportion of Russians and poverty level among seniors over the age of 65 in the United States with a correlation coefficient (R) of 0.654 and weighted average of 10.0%. Similarly, the statistical analysis conducted on geographies consisting of 148,656,198 people shows a slight positive correlation between the proportion of Afghans and poverty level among seniors over the age of 65 in the United States with a correlation coefficient (R) of 0.057 and weighted average of 9.8%, a difference of 2.3%.
Seniors Poverty Over the Age of 65 Correlation Summary
| Measurement | Russian | Afghan |
| Minimum | 0.56% | 0.71% |
| Maximum | 100.0% | 20.6% |
| Range | 99.4% | 19.9% |
| Mean | 16.4% | 8.8% |
| Median | 9.2% | 8.7% |
| Interquartile 25% (IQ1) | 6.8% | 6.8% |
| Interquartile 75% (IQ3) | 12.7% | 11.0% |
| Interquartile Range (IQR) | 5.9% | 4.2% |
| Standard Deviation (Sample) | 21.5% | 3.7% |
| Standard Deviation (Population) | 21.3% | 3.7% |
Demographics Similar to Russians and Afghans by Seniors Poverty Over the Age of 65
In terms of seniors poverty over the age of 65, the demographic groups most similar to Russians are Turkish (10.0%, a difference of 0.020%), Palestinian (10.0%, a difference of 0.030%), Yugoslavian (10.0%, a difference of 0.050%), Samoan (10.0%, a difference of 0.090%), and Australian (9.9%, a difference of 0.66%). Similarly, the demographic groups most similar to Afghans are Immigrants from England (9.8%, a difference of 0.12%), Immigrants from Northern Europe (9.8%, a difference of 0.13%), Bolivian (9.8%, a difference of 0.24%), Serbian (9.8%, a difference of 0.31%), and Immigrants from Canada (9.8%, a difference of 0.46%).
| Demographics | Rating | Rank | Seniors Poverty Over the Age of 65 |
| Immigrants | Northern Europe | 99.2 /100 | #54 | Exceptional 9.8% |
| Afghans | 99.2 /100 | #55 | Exceptional 9.8% |
| Immigrants | England | 99.1 /100 | #56 | Exceptional 9.8% |
| Bolivians | 99.1 /100 | #57 | Exceptional 9.8% |
| Serbians | 99.1 /100 | #58 | Exceptional 9.8% |
| Immigrants | Canada | 99.0 /100 | #59 | Exceptional 9.8% |
| Celtics | 99.0 /100 | #60 | Exceptional 9.8% |
| Iranians | 98.9 /100 | #61 | Exceptional 9.8% |
| French Canadians | 98.9 /100 | #62 | Exceptional 9.8% |
| Macedonians | 98.8 /100 | #63 | Exceptional 9.9% |
| Immigrants | North America | 98.8 /100 | #64 | Exceptional 9.9% |
| Pennsylvania Germans | 98.7 /100 | #65 | Exceptional 9.9% |
| Immigrants | Netherlands | 98.7 /100 | #66 | Exceptional 9.9% |
| Immigrants | Austria | 98.6 /100 | #67 | Exceptional 9.9% |
| Canadians | 98.5 /100 | #68 | Exceptional 9.9% |
| Australians | 98.4 /100 | #69 | Exceptional 9.9% |
| Samoans | 98.0 /100 | #70 | Exceptional 10.0% |
| Yugoslavians | 97.9 /100 | #71 | Exceptional 10.0% |
| Palestinians | 97.9 /100 | #72 | Exceptional 10.0% |
| Russians | 97.9 /100 | #73 | Exceptional 10.0% |
| Turks | 97.9 /100 | #74 | Exceptional 10.0% |