Immigrants from Japan vs Immigrants from Romania Seniors Poverty Over the Age of 65
COMPARE
Immigrants from Japan
Immigrants from Romania
Seniors Poverty Over the Age of 65
Seniors Poverty Over the Age of 65 Comparison
Immigrants from Japan
Immigrants from Romania
10.1%
SENIORS POVERTY OVER THE AGE OF 65
96.3/ 100
METRIC RATING
95th/ 347
METRIC RANK
10.3%
SENIORS POVERTY OVER THE AGE OF 65
93.3/ 100
METRIC RATING
113th/ 347
METRIC RANK
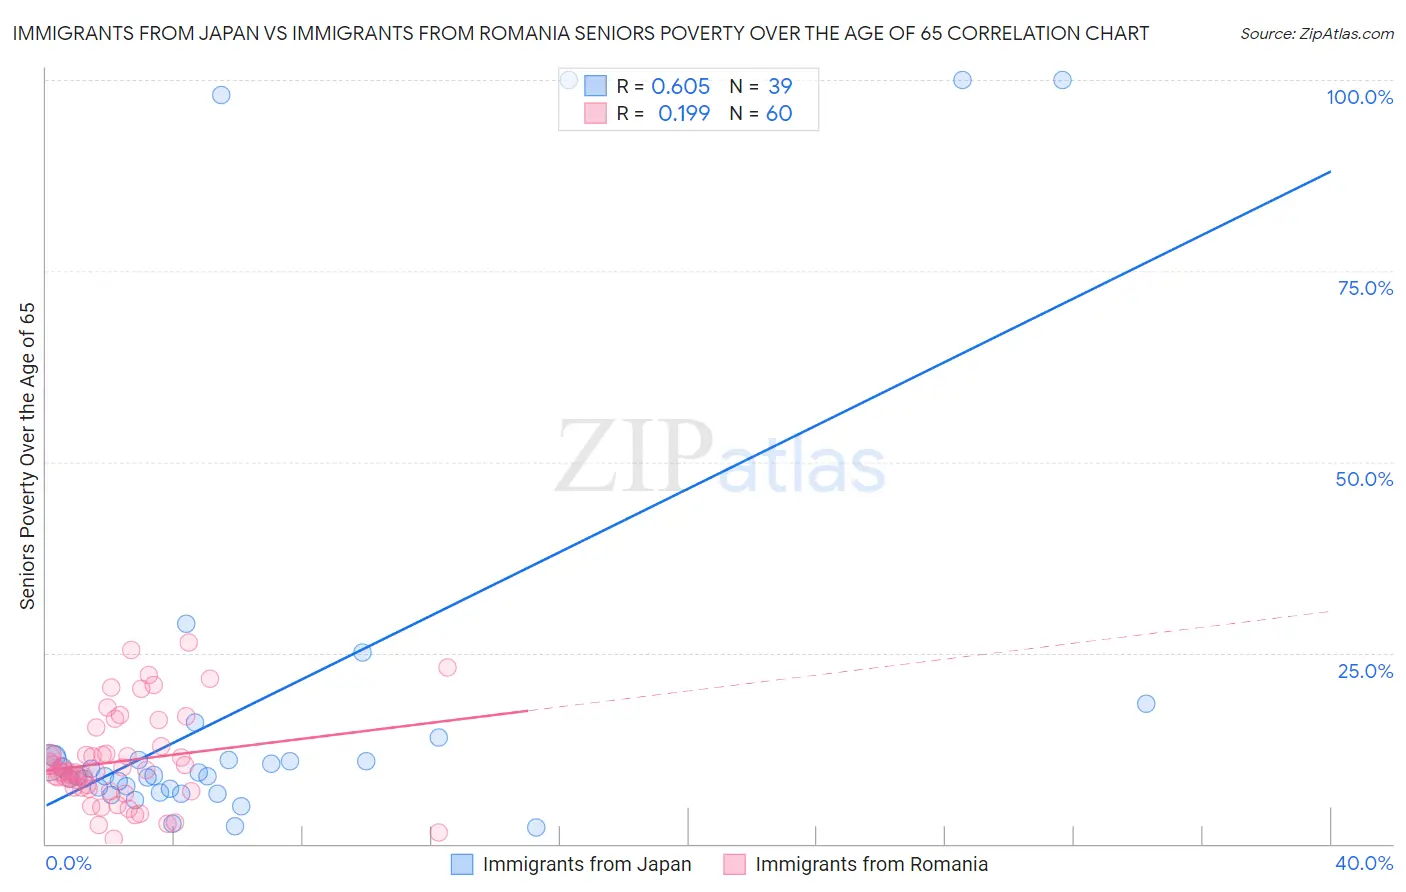
Immigrants from Japan vs Immigrants from Romania Seniors Poverty Over the Age of 65 Correlation Chart
The statistical analysis conducted on geographies consisting of 339,182,731 people shows a significant positive correlation between the proportion of Immigrants from Japan and poverty level among seniors over the age of 65 in the United States with a correlation coefficient (R) of 0.605 and weighted average of 10.1%. Similarly, the statistical analysis conducted on geographies consisting of 256,618,313 people shows a poor positive correlation between the proportion of Immigrants from Romania and poverty level among seniors over the age of 65 in the United States with a correlation coefficient (R) of 0.199 and weighted average of 10.3%, a difference of 1.5%.
Seniors Poverty Over the Age of 65 Correlation Summary
| Measurement | Immigrants from Japan | Immigrants from Romania |
| Minimum | 2.1% | 0.70% |
| Maximum | 100.0% | 26.4% |
| Range | 97.9% | 25.7% |
| Mean | 19.0% | 10.8% |
| Median | 8.9% | 9.4% |
| Interquartile 25% (IQ1) | 7.2% | 7.3% |
| Interquartile 75% (IQ3) | 11.5% | 12.3% |
| Interquartile Range (IQR) | 4.2% | 5.0% |
| Standard Deviation (Sample) | 28.0% | 6.0% |
| Standard Deviation (Population) | 27.7% | 5.9% |
Demographics Similar to Immigrants from Japan and Immigrants from Romania by Seniors Poverty Over the Age of 65
In terms of seniors poverty over the age of 65, the demographic groups most similar to Immigrants from Japan are Immigrants from Germany (10.1%, a difference of 0.23%), Basque (10.2%, a difference of 0.28%), Immigrants from Pakistan (10.2%, a difference of 0.37%), Immigrants from Kuwait (10.2%, a difference of 0.53%), and Cypriot (10.2%, a difference of 0.53%). Similarly, the demographic groups most similar to Immigrants from Romania are Immigrants from Korea (10.3%, a difference of 0.040%), Immigrants from Belgium (10.3%, a difference of 0.060%), Immigrants from Zimbabwe (10.3%, a difference of 0.090%), Immigrants from Denmark (10.3%, a difference of 0.19%), and Syrian (10.3%, a difference of 0.23%).
| Demographics | Rating | Rank | Seniors Poverty Over the Age of 65 |
| Immigrants | Germany | 96.7 /100 | #94 | Exceptional 10.1% |
| Immigrants | Japan | 96.3 /100 | #95 | Exceptional 10.1% |
| Basques | 95.9 /100 | #96 | Exceptional 10.2% |
| Immigrants | Pakistan | 95.7 /100 | #97 | Exceptional 10.2% |
| Immigrants | Kuwait | 95.5 /100 | #98 | Exceptional 10.2% |
| Cypriots | 95.5 /100 | #99 | Exceptional 10.2% |
| Marshallese | 95.3 /100 | #100 | Exceptional 10.2% |
| Immigrants | Jordan | 94.7 /100 | #101 | Exceptional 10.2% |
| Delaware | 94.5 /100 | #102 | Exceptional 10.2% |
| Icelanders | 94.4 /100 | #103 | Exceptional 10.3% |
| South Africans | 94.3 /100 | #104 | Exceptional 10.3% |
| Aleuts | 94.1 /100 | #105 | Exceptional 10.3% |
| Kenyans | 94.1 /100 | #106 | Exceptional 10.3% |
| Hawaiians | 93.9 /100 | #107 | Exceptional 10.3% |
| Immigrants | Croatia | 93.9 /100 | #108 | Exceptional 10.3% |
| Syrians | 93.8 /100 | #109 | Exceptional 10.3% |
| Immigrants | Zimbabwe | 93.5 /100 | #110 | Exceptional 10.3% |
| Immigrants | Belgium | 93.4 /100 | #111 | Exceptional 10.3% |
| Immigrants | Korea | 93.3 /100 | #112 | Exceptional 10.3% |
| Immigrants | Romania | 93.3 /100 | #113 | Exceptional 10.3% |
| Immigrants | Denmark | 92.7 /100 | #114 | Exceptional 10.3% |