Immigrants from Italy vs U.S. Virgin Islander Family Poverty
COMPARE
Immigrants from Italy
U.S. Virgin Islander
Family Poverty
Family Poverty Comparison
Immigrants from Italy
U.S. Virgin Islanders
8.0%
FAMILY POVERTY
97.0/ 100
METRIC RATING
91st/ 347
METRIC RANK
12.4%
FAMILY POVERTY
0.0/ 100
METRIC RATING
318th/ 347
METRIC RANK
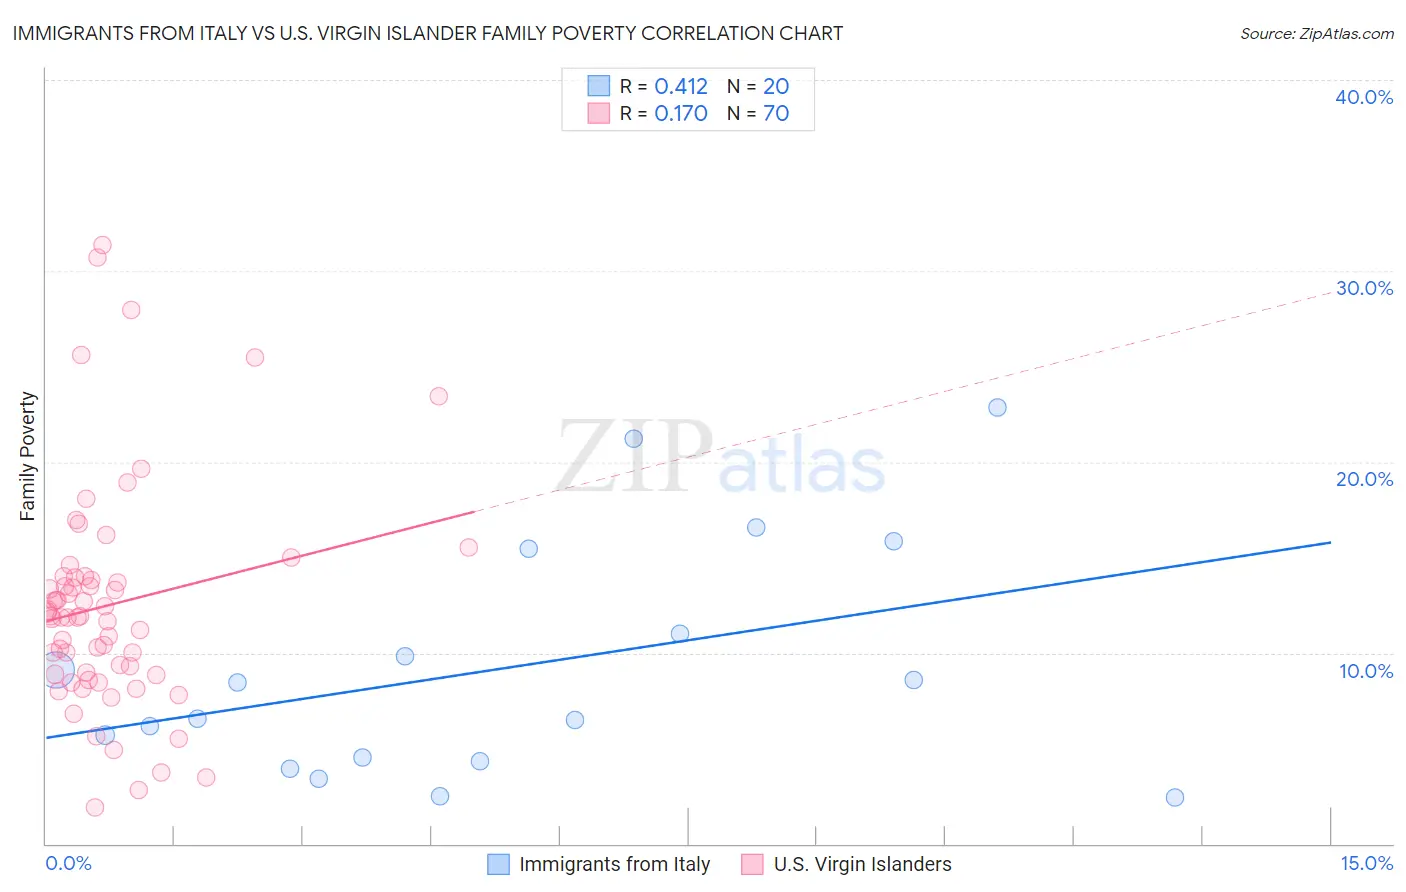
Immigrants from Italy vs U.S. Virgin Islander Family Poverty Correlation Chart
The statistical analysis conducted on geographies consisting of 323,411,315 people shows a moderate positive correlation between the proportion of Immigrants from Italy and poverty level among families in the United States with a correlation coefficient (R) of 0.412 and weighted average of 8.0%. Similarly, the statistical analysis conducted on geographies consisting of 87,485,330 people shows a poor positive correlation between the proportion of U.S. Virgin Islanders and poverty level among families in the United States with a correlation coefficient (R) of 0.170 and weighted average of 12.4%, a difference of 55.3%.
Family Poverty Correlation Summary
| Measurement | Immigrants from Italy | U.S. Virgin Islander |
| Minimum | 2.4% | 1.9% |
| Maximum | 22.9% | 31.4% |
| Range | 20.5% | 29.5% |
| Mean | 9.2% | 12.5% |
| Median | 7.5% | 11.9% |
| Interquartile 25% (IQ1) | 4.4% | 8.9% |
| Interquartile 75% (IQ3) | 13.2% | 14.0% |
| Interquartile Range (IQR) | 8.8% | 5.1% |
| Standard Deviation (Sample) | 6.1% | 5.9% |
| Standard Deviation (Population) | 5.9% | 5.9% |
Similar Demographics by Family Poverty
Demographics Similar to Immigrants from Italy by Family Poverty
In terms of family poverty, the demographic groups most similar to Immigrants from Italy are Immigrants from Denmark (8.0%, a difference of 0.16%), Immigrants from England (8.0%, a difference of 0.16%), Czechoslovakian (8.0%, a difference of 0.24%), Serbian (8.0%, a difference of 0.31%), and Belgian (8.0%, a difference of 0.37%).
| Demographics | Rating | Rank | Family Poverty |
| British | 97.5 /100 | #84 | Exceptional 7.9% |
| Immigrants | Asia | 97.4 /100 | #85 | Exceptional 7.9% |
| Scottish | 97.3 /100 | #86 | Exceptional 7.9% |
| Belgians | 97.3 /100 | #87 | Exceptional 8.0% |
| Serbians | 97.2 /100 | #88 | Exceptional 8.0% |
| Immigrants | Denmark | 97.1 /100 | #89 | Exceptional 8.0% |
| Immigrants | England | 97.1 /100 | #90 | Exceptional 8.0% |
| Immigrants | Italy | 97.0 /100 | #91 | Exceptional 8.0% |
| Czechoslovakians | 96.8 /100 | #92 | Exceptional 8.0% |
| Tlingit-Haida | 96.7 /100 | #93 | Exceptional 8.0% |
| Immigrants | Pakistan | 96.6 /100 | #94 | Exceptional 8.0% |
| Immigrants | Philippines | 96.5 /100 | #95 | Exceptional 8.0% |
| Immigrants | Turkey | 96.5 /100 | #96 | Exceptional 8.0% |
| Immigrants | Switzerland | 96.1 /100 | #97 | Exceptional 8.1% |
| Immigrants | South Africa | 95.9 /100 | #98 | Exceptional 8.1% |
Demographics Similar to U.S. Virgin Islanders by Family Poverty
In terms of family poverty, the demographic groups most similar to U.S. Virgin Islanders are Immigrants from Grenada (12.4%, a difference of 0.010%), British West Indian (12.4%, a difference of 0.050%), Honduran (12.4%, a difference of 0.22%), Inupiat (12.5%, a difference of 0.53%), and Immigrants from Mexico (12.3%, a difference of 0.96%).
| Demographics | Rating | Rank | Family Poverty |
| Ute | 0.0 /100 | #311 | Tragic 12.1% |
| Immigrants | Central America | 0.0 /100 | #312 | Tragic 12.1% |
| Immigrants | Caribbean | 0.0 /100 | #313 | Tragic 12.2% |
| Kiowa | 0.0 /100 | #314 | Tragic 12.2% |
| Immigrants | Mexico | 0.0 /100 | #315 | Tragic 12.3% |
| Hondurans | 0.0 /100 | #316 | Tragic 12.4% |
| Immigrants | Grenada | 0.0 /100 | #317 | Tragic 12.4% |
| U.S. Virgin Islanders | 0.0 /100 | #318 | Tragic 12.4% |
| British West Indians | 0.0 /100 | #319 | Tragic 12.4% |
| Inupiat | 0.0 /100 | #320 | Tragic 12.5% |
| Arapaho | 0.0 /100 | #321 | Tragic 12.7% |
| Immigrants | Honduras | 0.0 /100 | #322 | Tragic 12.7% |
| Menominee | 0.0 /100 | #323 | Tragic 12.7% |
| Immigrants | Dominica | 0.0 /100 | #324 | Tragic 12.7% |
| Paiute | 0.0 /100 | #325 | Tragic 13.0% |