Basque vs U.S. Virgin Islander Family Poverty
COMPARE
Basque
U.S. Virgin Islander
Family Poverty
Family Poverty Comparison
Basques
U.S. Virgin Islanders
8.1%
FAMILY POVERTY
94.9/ 100
METRIC RATING
108th/ 347
METRIC RANK
12.4%
FAMILY POVERTY
0.0/ 100
METRIC RATING
318th/ 347
METRIC RANK
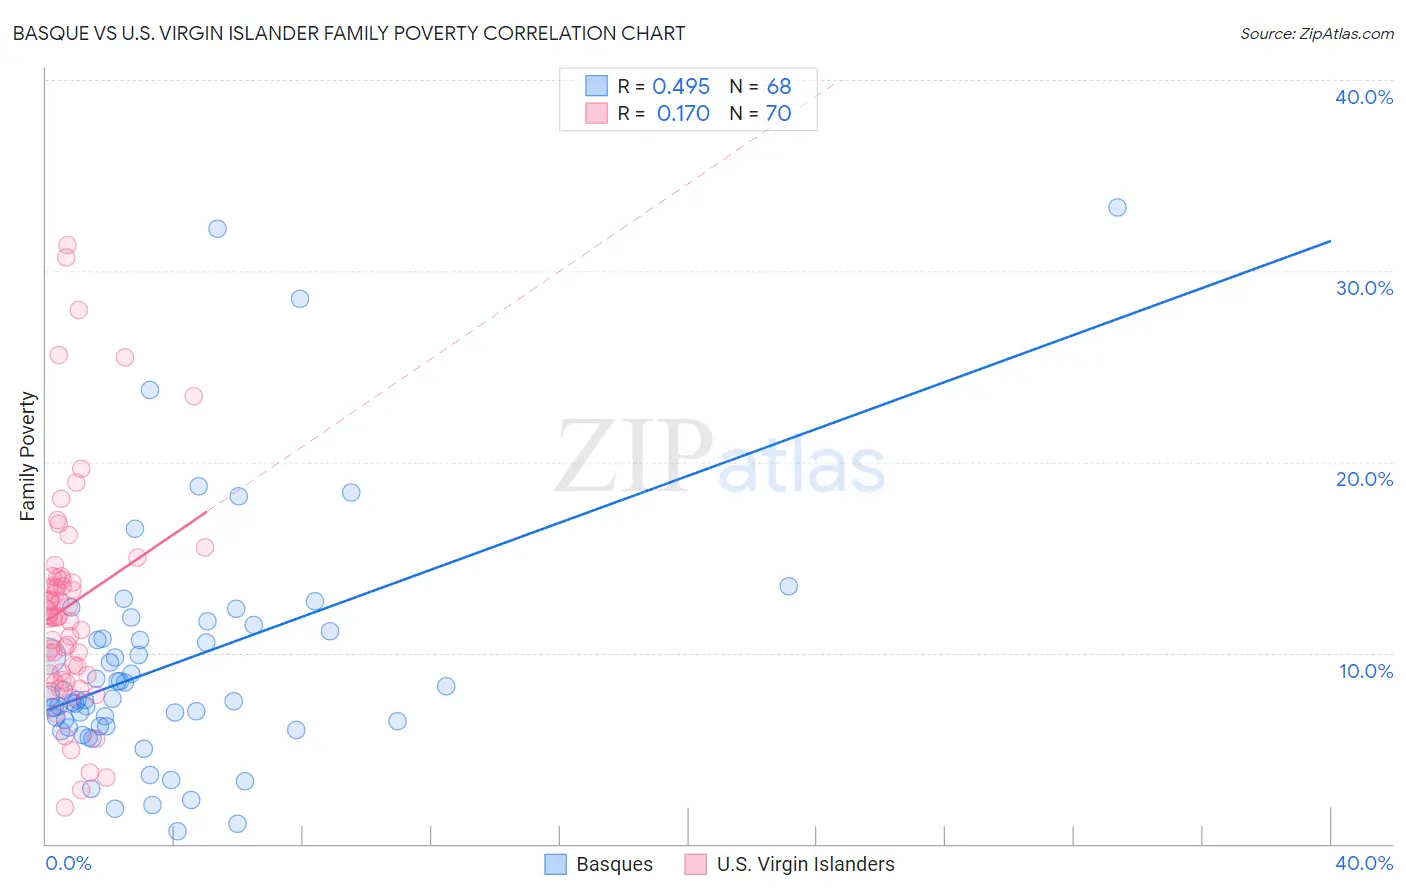
Basque vs U.S. Virgin Islander Family Poverty Correlation Chart
The statistical analysis conducted on geographies consisting of 165,603,932 people shows a moderate positive correlation between the proportion of Basques and poverty level among families in the United States with a correlation coefficient (R) of 0.495 and weighted average of 8.1%. Similarly, the statistical analysis conducted on geographies consisting of 87,485,330 people shows a poor positive correlation between the proportion of U.S. Virgin Islanders and poverty level among families in the United States with a correlation coefficient (R) of 0.170 and weighted average of 12.4%, a difference of 52.2%.
Family Poverty Correlation Summary
| Measurement | Basque | U.S. Virgin Islander |
| Minimum | 0.66% | 1.9% |
| Maximum | 33.3% | 31.4% |
| Range | 32.7% | 29.5% |
| Mean | 9.4% | 12.5% |
| Median | 7.6% | 11.9% |
| Interquartile 25% (IQ1) | 6.2% | 8.9% |
| Interquartile 75% (IQ3) | 10.9% | 14.0% |
| Interquartile Range (IQR) | 4.8% | 5.1% |
| Standard Deviation (Sample) | 6.4% | 5.9% |
| Standard Deviation (Population) | 6.3% | 5.9% |
Similar Demographics by Family Poverty
Demographics Similar to Basques by Family Poverty
In terms of family poverty, the demographic groups most similar to Basques are French Canadian (8.1%, a difference of 0.090%), Jordanian (8.2%, a difference of 0.090%), Egyptian (8.1%, a difference of 0.13%), Romanian (8.2%, a difference of 0.18%), and Taiwanese (8.2%, a difference of 0.23%).
| Demographics | Rating | Rank | Family Poverty |
| Immigrants | Norway | 95.7 /100 | #101 | Exceptional 8.1% |
| Immigrants | Indonesia | 95.7 /100 | #102 | Exceptional 8.1% |
| Immigrants | Eastern Europe | 95.6 /100 | #103 | Exceptional 8.1% |
| Slavs | 95.6 /100 | #104 | Exceptional 8.1% |
| Laotians | 95.6 /100 | #105 | Exceptional 8.1% |
| Egyptians | 95.1 /100 | #106 | Exceptional 8.1% |
| French Canadians | 95.0 /100 | #107 | Exceptional 8.1% |
| Basques | 94.9 /100 | #108 | Exceptional 8.1% |
| Jordanians | 94.8 /100 | #109 | Exceptional 8.2% |
| Romanians | 94.7 /100 | #110 | Exceptional 8.2% |
| Taiwanese | 94.6 /100 | #111 | Exceptional 8.2% |
| Immigrants | France | 94.4 /100 | #112 | Exceptional 8.2% |
| Canadians | 94.2 /100 | #113 | Exceptional 8.2% |
| Immigrants | Zimbabwe | 94.0 /100 | #114 | Exceptional 8.2% |
| Immigrants | Israel | 93.5 /100 | #115 | Exceptional 8.2% |
Demographics Similar to U.S. Virgin Islanders by Family Poverty
In terms of family poverty, the demographic groups most similar to U.S. Virgin Islanders are Immigrants from Grenada (12.4%, a difference of 0.010%), British West Indian (12.4%, a difference of 0.050%), Honduran (12.4%, a difference of 0.22%), Inupiat (12.5%, a difference of 0.53%), and Immigrants from Mexico (12.3%, a difference of 0.96%).
| Demographics | Rating | Rank | Family Poverty |
| Ute | 0.0 /100 | #311 | Tragic 12.1% |
| Immigrants | Central America | 0.0 /100 | #312 | Tragic 12.1% |
| Immigrants | Caribbean | 0.0 /100 | #313 | Tragic 12.2% |
| Kiowa | 0.0 /100 | #314 | Tragic 12.2% |
| Immigrants | Mexico | 0.0 /100 | #315 | Tragic 12.3% |
| Hondurans | 0.0 /100 | #316 | Tragic 12.4% |
| Immigrants | Grenada | 0.0 /100 | #317 | Tragic 12.4% |
| U.S. Virgin Islanders | 0.0 /100 | #318 | Tragic 12.4% |
| British West Indians | 0.0 /100 | #319 | Tragic 12.4% |
| Inupiat | 0.0 /100 | #320 | Tragic 12.5% |
| Arapaho | 0.0 /100 | #321 | Tragic 12.7% |
| Immigrants | Honduras | 0.0 /100 | #322 | Tragic 12.7% |
| Menominee | 0.0 /100 | #323 | Tragic 12.7% |
| Immigrants | Dominica | 0.0 /100 | #324 | Tragic 12.7% |
| Paiute | 0.0 /100 | #325 | Tragic 13.0% |