Immigrants from Italy vs English Family Poverty
COMPARE
Immigrants from Italy
English
Family Poverty
Family Poverty Comparison
Immigrants from Italy
English
8.0%
FAMILY POVERTY
97.0/ 100
METRIC RATING
91st/ 347
METRIC RANK
7.9%
FAMILY POVERTY
97.8/ 100
METRIC RATING
80th/ 347
METRIC RANK
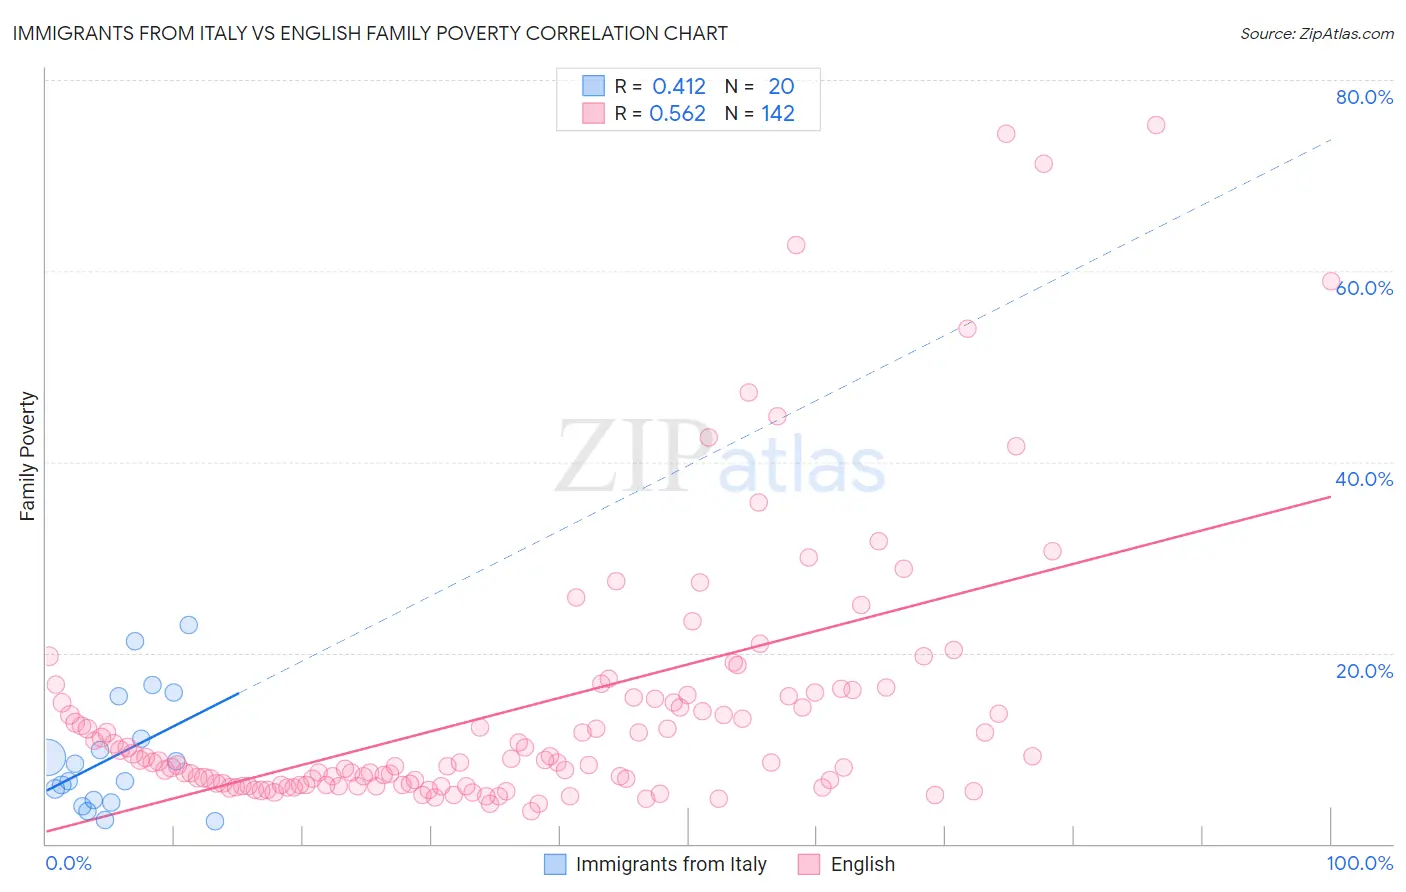
Immigrants from Italy vs English Family Poverty Correlation Chart
The statistical analysis conducted on geographies consisting of 323,411,315 people shows a moderate positive correlation between the proportion of Immigrants from Italy and poverty level among families in the United States with a correlation coefficient (R) of 0.412 and weighted average of 8.0%. Similarly, the statistical analysis conducted on geographies consisting of 573,938,644 people shows a substantial positive correlation between the proportion of English and poverty level among families in the United States with a correlation coefficient (R) of 0.562 and weighted average of 7.9%, a difference of 1.2%.
Family Poverty Correlation Summary
| Measurement | Immigrants from Italy | English |
| Minimum | 2.4% | 3.4% |
| Maximum | 22.9% | 75.3% |
| Range | 20.5% | 71.9% |
| Mean | 9.2% | 14.1% |
| Median | 7.5% | 8.6% |
| Interquartile 25% (IQ1) | 4.4% | 6.2% |
| Interquartile 75% (IQ3) | 13.2% | 15.3% |
| Interquartile Range (IQR) | 8.8% | 9.2% |
| Standard Deviation (Sample) | 6.1% | 13.9% |
| Standard Deviation (Population) | 5.9% | 13.9% |
Demographics Similar to Immigrants from Italy and English by Family Poverty
In terms of family poverty, the demographic groups most similar to Immigrants from Italy are Immigrants from Denmark (8.0%, a difference of 0.16%), Immigrants from England (8.0%, a difference of 0.16%), Czechoslovakian (8.0%, a difference of 0.24%), Serbian (8.0%, a difference of 0.31%), and Belgian (8.0%, a difference of 0.37%). Similarly, the demographic groups most similar to English are Irish (7.9%, a difference of 0.010%), Immigrants from Poland (7.9%, a difference of 0.030%), Immigrants from Europe (7.9%, a difference of 0.060%), Immigrants from North America (7.9%, a difference of 0.14%), and Slovak (7.9%, a difference of 0.21%).
| Demographics | Rating | Rank | Family Poverty |
| Immigrants | Croatia | 98.1 /100 | #75 | Exceptional 7.8% |
| Immigrants | Latvia | 98.0 /100 | #76 | Exceptional 7.9% |
| Ukrainians | 98.0 /100 | #77 | Exceptional 7.9% |
| Immigrants | North America | 97.9 /100 | #78 | Exceptional 7.9% |
| Immigrants | Europe | 97.8 /100 | #79 | Exceptional 7.9% |
| English | 97.8 /100 | #80 | Exceptional 7.9% |
| Irish | 97.8 /100 | #81 | Exceptional 7.9% |
| Immigrants | Poland | 97.8 /100 | #82 | Exceptional 7.9% |
| Slovaks | 97.7 /100 | #83 | Exceptional 7.9% |
| British | 97.5 /100 | #84 | Exceptional 7.9% |
| Immigrants | Asia | 97.4 /100 | #85 | Exceptional 7.9% |
| Scottish | 97.3 /100 | #86 | Exceptional 7.9% |
| Belgians | 97.3 /100 | #87 | Exceptional 8.0% |
| Serbians | 97.2 /100 | #88 | Exceptional 8.0% |
| Immigrants | Denmark | 97.1 /100 | #89 | Exceptional 8.0% |
| Immigrants | England | 97.1 /100 | #90 | Exceptional 8.0% |
| Immigrants | Italy | 97.0 /100 | #91 | Exceptional 8.0% |
| Czechoslovakians | 96.8 /100 | #92 | Exceptional 8.0% |
| Tlingit-Haida | 96.7 /100 | #93 | Exceptional 8.0% |
| Immigrants | Pakistan | 96.6 /100 | #94 | Exceptional 8.0% |
| Immigrants | Philippines | 96.5 /100 | #95 | Exceptional 8.0% |