Immigrants from Italy vs Guyanese Family Poverty
COMPARE
Immigrants from Italy
Guyanese
Family Poverty
Family Poverty Comparison
Immigrants from Italy
Guyanese
8.0%
FAMILY POVERTY
97.0/ 100
METRIC RATING
91st/ 347
METRIC RANK
11.2%
FAMILY POVERTY
0.1/ 100
METRIC RATING
278th/ 347
METRIC RANK
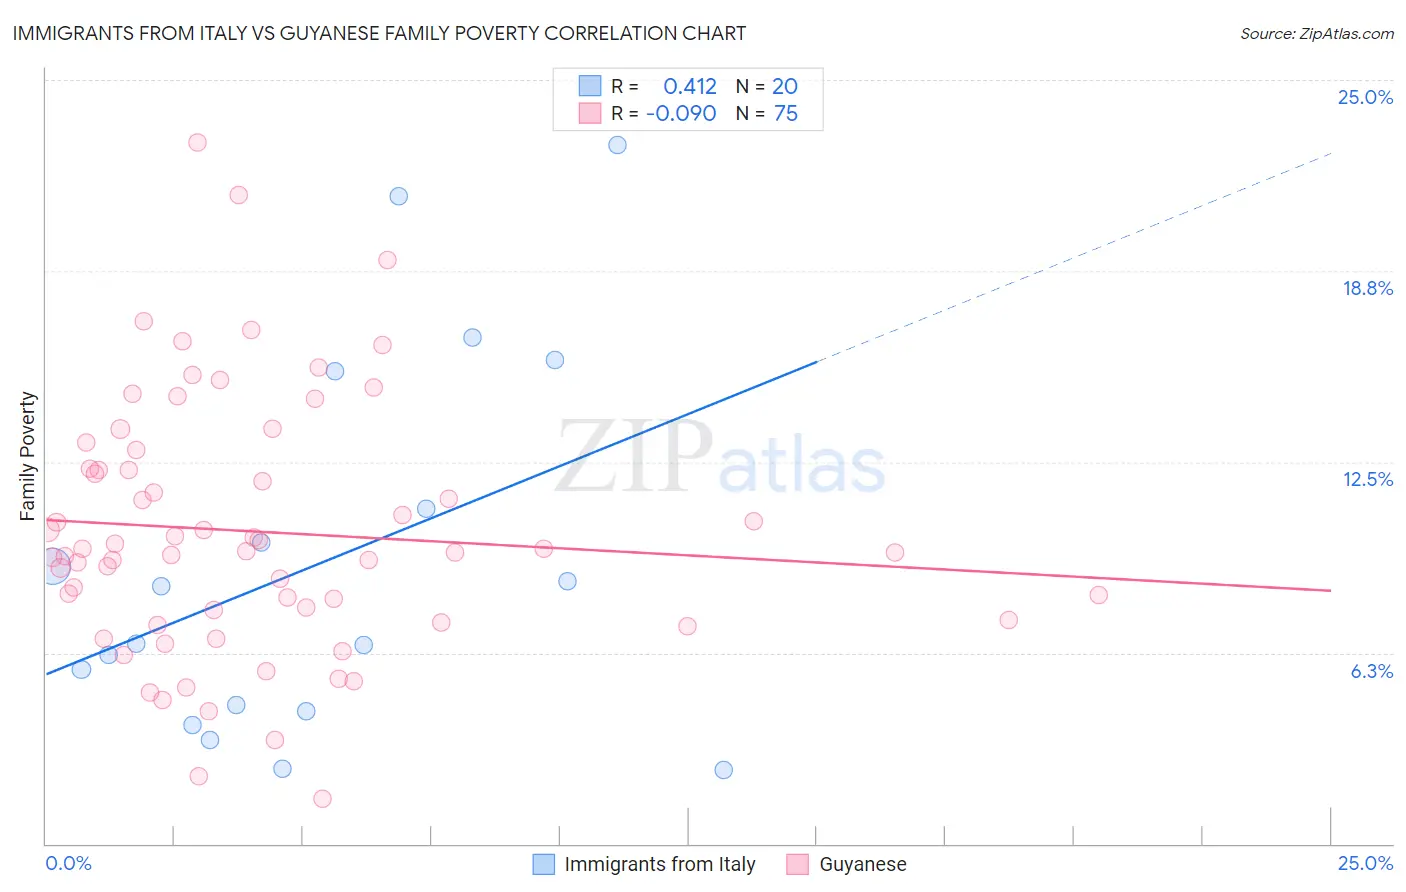
Immigrants from Italy vs Guyanese Family Poverty Correlation Chart
The statistical analysis conducted on geographies consisting of 323,411,315 people shows a moderate positive correlation between the proportion of Immigrants from Italy and poverty level among families in the United States with a correlation coefficient (R) of 0.412 and weighted average of 8.0%. Similarly, the statistical analysis conducted on geographies consisting of 176,578,475 people shows a slight negative correlation between the proportion of Guyanese and poverty level among families in the United States with a correlation coefficient (R) of -0.090 and weighted average of 11.2%, a difference of 40.8%.
Family Poverty Correlation Summary
| Measurement | Immigrants from Italy | Guyanese |
| Minimum | 2.4% | 1.5% |
| Maximum | 22.9% | 22.9% |
| Range | 20.5% | 21.5% |
| Mean | 9.2% | 10.2% |
| Median | 7.5% | 9.6% |
| Interquartile 25% (IQ1) | 4.4% | 7.3% |
| Interquartile 75% (IQ3) | 13.2% | 12.3% |
| Interquartile Range (IQR) | 8.8% | 4.9% |
| Standard Deviation (Sample) | 6.1% | 4.2% |
| Standard Deviation (Population) | 5.9% | 4.1% |
Similar Demographics by Family Poverty
Demographics Similar to Immigrants from Italy by Family Poverty
In terms of family poverty, the demographic groups most similar to Immigrants from Italy are Immigrants from Denmark (8.0%, a difference of 0.16%), Immigrants from England (8.0%, a difference of 0.16%), Czechoslovakian (8.0%, a difference of 0.24%), Serbian (8.0%, a difference of 0.31%), and Belgian (8.0%, a difference of 0.37%).
| Demographics | Rating | Rank | Family Poverty |
| British | 97.5 /100 | #84 | Exceptional 7.9% |
| Immigrants | Asia | 97.4 /100 | #85 | Exceptional 7.9% |
| Scottish | 97.3 /100 | #86 | Exceptional 7.9% |
| Belgians | 97.3 /100 | #87 | Exceptional 8.0% |
| Serbians | 97.2 /100 | #88 | Exceptional 8.0% |
| Immigrants | Denmark | 97.1 /100 | #89 | Exceptional 8.0% |
| Immigrants | England | 97.1 /100 | #90 | Exceptional 8.0% |
| Immigrants | Italy | 97.0 /100 | #91 | Exceptional 8.0% |
| Czechoslovakians | 96.8 /100 | #92 | Exceptional 8.0% |
| Tlingit-Haida | 96.7 /100 | #93 | Exceptional 8.0% |
| Immigrants | Pakistan | 96.6 /100 | #94 | Exceptional 8.0% |
| Immigrants | Philippines | 96.5 /100 | #95 | Exceptional 8.0% |
| Immigrants | Turkey | 96.5 /100 | #96 | Exceptional 8.0% |
| Immigrants | Switzerland | 96.1 /100 | #97 | Exceptional 8.1% |
| Immigrants | South Africa | 95.9 /100 | #98 | Exceptional 8.1% |
Demographics Similar to Guyanese by Family Poverty
In terms of family poverty, the demographic groups most similar to Guyanese are Chippewa (11.2%, a difference of 0.030%), Immigrants from Guyana (11.2%, a difference of 0.12%), Central American (11.2%, a difference of 0.14%), Blackfeet (11.3%, a difference of 0.14%), and Belizean (11.3%, a difference of 0.18%).
| Demographics | Rating | Rank | Family Poverty |
| Immigrants | Bahamas | 0.1 /100 | #271 | Tragic 11.1% |
| Immigrants | Jamaica | 0.1 /100 | #272 | Tragic 11.2% |
| Somalis | 0.1 /100 | #273 | Tragic 11.2% |
| Spanish Americans | 0.1 /100 | #274 | Tragic 11.2% |
| Central Americans | 0.1 /100 | #275 | Tragic 11.2% |
| Immigrants | Guyana | 0.1 /100 | #276 | Tragic 11.2% |
| Chippewa | 0.1 /100 | #277 | Tragic 11.2% |
| Guyanese | 0.1 /100 | #278 | Tragic 11.2% |
| Blackfeet | 0.0 /100 | #279 | Tragic 11.3% |
| Belizeans | 0.0 /100 | #280 | Tragic 11.3% |
| Immigrants | West Indies | 0.0 /100 | #281 | Tragic 11.3% |
| Immigrants | Cuba | 0.0 /100 | #282 | Tragic 11.3% |
| Indonesians | 0.0 /100 | #283 | Tragic 11.3% |
| Yaqui | 0.0 /100 | #284 | Tragic 11.3% |
| Barbadians | 0.0 /100 | #285 | Tragic 11.3% |