Immigrants from Indonesia vs Ethiopian Male Poverty
COMPARE
Immigrants from Indonesia
Ethiopian
Male Poverty
Male Poverty Comparison
Immigrants from Indonesia
Ethiopians
10.5%
MALE POVERTY
93.3/ 100
METRIC RATING
99th/ 347
METRIC RANK
11.1%
MALE POVERTY
56.7/ 100
METRIC RATING
164th/ 347
METRIC RANK
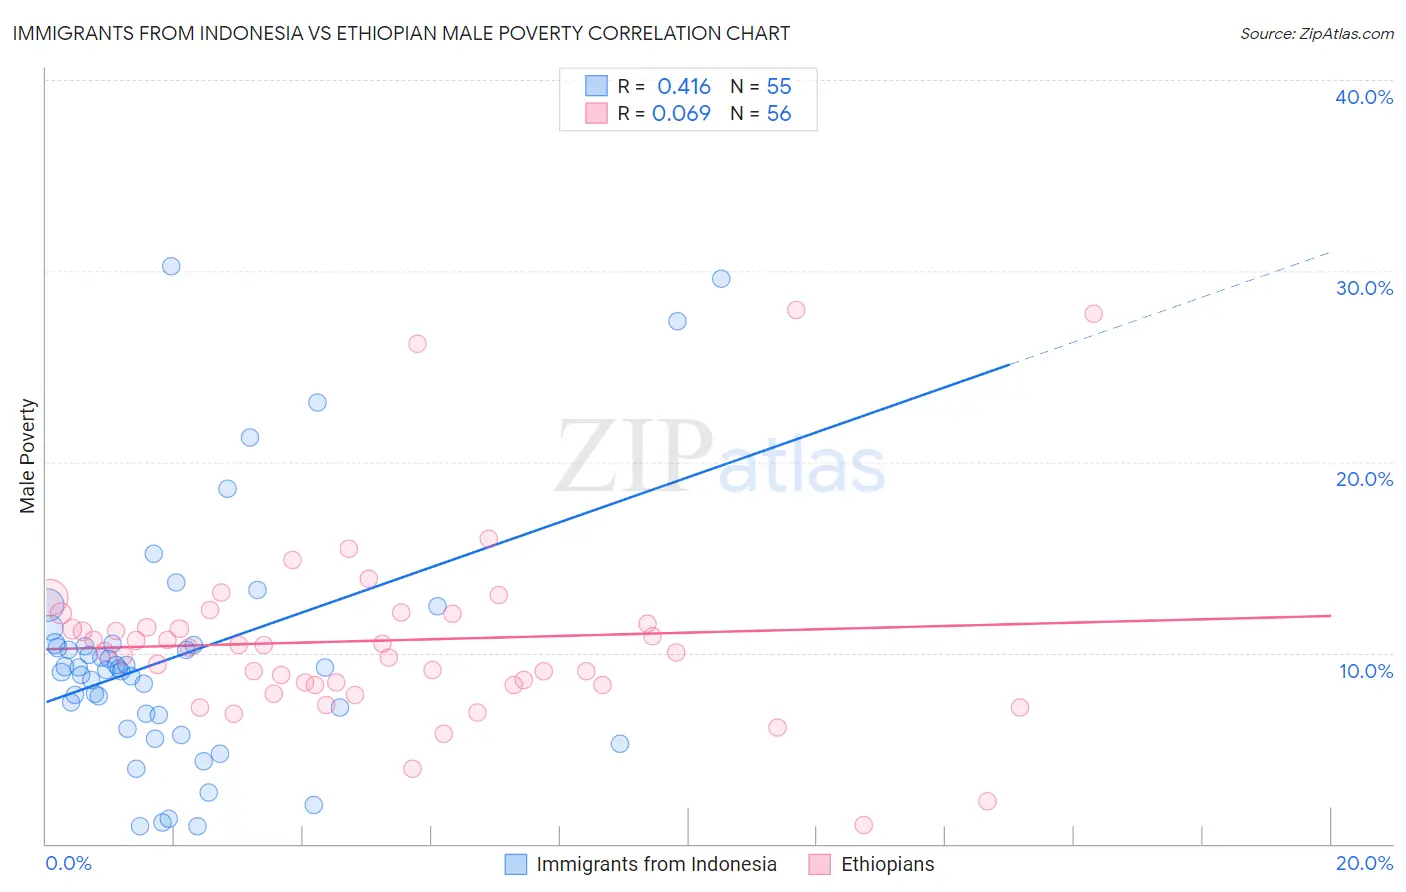
Immigrants from Indonesia vs Ethiopian Male Poverty Correlation Chart
The statistical analysis conducted on geographies consisting of 215,697,022 people shows a moderate positive correlation between the proportion of Immigrants from Indonesia and poverty level among males in the United States with a correlation coefficient (R) of 0.416 and weighted average of 10.5%. Similarly, the statistical analysis conducted on geographies consisting of 223,096,222 people shows a slight positive correlation between the proportion of Ethiopians and poverty level among males in the United States with a correlation coefficient (R) of 0.069 and weighted average of 11.1%, a difference of 6.2%.
Male Poverty Correlation Summary
| Measurement | Immigrants from Indonesia | Ethiopian |
| Minimum | 0.89% | 1.0% |
| Maximum | 30.3% | 28.0% |
| Range | 29.4% | 27.0% |
| Mean | 9.9% | 10.6% |
| Median | 9.2% | 10.2% |
| Interquartile 25% (IQ1) | 6.8% | 8.3% |
| Interquartile 75% (IQ3) | 10.5% | 11.8% |
| Interquartile Range (IQR) | 3.7% | 3.5% |
| Standard Deviation (Sample) | 6.4% | 4.9% |
| Standard Deviation (Population) | 6.3% | 4.9% |
Similar Demographics by Male Poverty
Demographics Similar to Immigrants from Indonesia by Male Poverty
In terms of male poverty, the demographic groups most similar to Immigrants from Indonesia are Finnish (10.5%, a difference of 0.060%), Romanian (10.5%, a difference of 0.13%), Immigrants from Egypt (10.4%, a difference of 0.18%), Immigrants from Latvia (10.5%, a difference of 0.21%), and Scottish (10.4%, a difference of 0.31%).
| Demographics | Rating | Rank | Male Poverty |
| Jordanians | 94.4 /100 | #92 | Exceptional 10.4% |
| Australians | 94.4 /100 | #93 | Exceptional 10.4% |
| Immigrants | South Africa | 94.1 /100 | #94 | Exceptional 10.4% |
| Scottish | 94.0 /100 | #95 | Exceptional 10.4% |
| Immigrants | Egypt | 93.7 /100 | #96 | Exceptional 10.4% |
| Romanians | 93.6 /100 | #97 | Exceptional 10.5% |
| Finns | 93.4 /100 | #98 | Exceptional 10.5% |
| Immigrants | Indonesia | 93.3 /100 | #99 | Exceptional 10.5% |
| Immigrants | Latvia | 92.8 /100 | #100 | Exceptional 10.5% |
| Immigrants | Zimbabwe | 92.0 /100 | #101 | Exceptional 10.5% |
| French Canadians | 91.9 /100 | #102 | Exceptional 10.5% |
| Slavs | 91.7 /100 | #103 | Exceptional 10.5% |
| Welsh | 91.6 /100 | #104 | Exceptional 10.5% |
| Canadians | 91.6 /100 | #105 | Exceptional 10.5% |
| Immigrants | Southern Europe | 91.3 /100 | #106 | Exceptional 10.5% |
Demographics Similar to Ethiopians by Male Poverty
In terms of male poverty, the demographic groups most similar to Ethiopians are White/Caucasian (11.1%, a difference of 0.010%), Immigrants from Chile (11.1%, a difference of 0.070%), Immigrants from Spain (11.1%, a difference of 0.12%), Immigrants from Albania (11.1%, a difference of 0.14%), and Hungarian (11.1%, a difference of 0.16%).
| Demographics | Rating | Rank | Male Poverty |
| Scotch-Irish | 63.7 /100 | #157 | Good 11.0% |
| Colombians | 63.0 /100 | #158 | Good 11.0% |
| Taiwanese | 62.7 /100 | #159 | Good 11.0% |
| Soviet Union | 60.3 /100 | #160 | Good 11.1% |
| Immigrants | Northern Africa | 59.7 /100 | #161 | Average 11.1% |
| Immigrants | Chile | 57.4 /100 | #162 | Average 11.1% |
| Whites/Caucasians | 56.7 /100 | #163 | Average 11.1% |
| Ethiopians | 56.7 /100 | #164 | Average 11.1% |
| Immigrants | Spain | 55.5 /100 | #165 | Average 11.1% |
| Immigrants | Albania | 55.3 /100 | #166 | Average 11.1% |
| Hungarians | 55.1 /100 | #167 | Average 11.1% |
| Immigrants | Portugal | 54.9 /100 | #168 | Average 11.1% |
| Immigrants | Colombia | 54.2 /100 | #169 | Average 11.1% |
| South Americans | 53.8 /100 | #170 | Average 11.1% |
| Uruguayans | 51.0 /100 | #171 | Average 11.2% |