Immigrants from Hong Kong vs Mexican American Indian Births to Unmarried Women
COMPARE
Immigrants from Hong Kong
Mexican American Indian
Births to Unmarried Women
Births to Unmarried Women Comparison
Immigrants from Hong Kong
Mexican American Indians
23.6%
BIRTHS TO UNMARRIED WOMEN
100.0/ 100
METRIC RATING
5th/ 347
METRIC RANK
35.7%
BIRTHS TO UNMARRIED WOMEN
0.4/ 100
METRIC RATING
250th/ 347
METRIC RANK
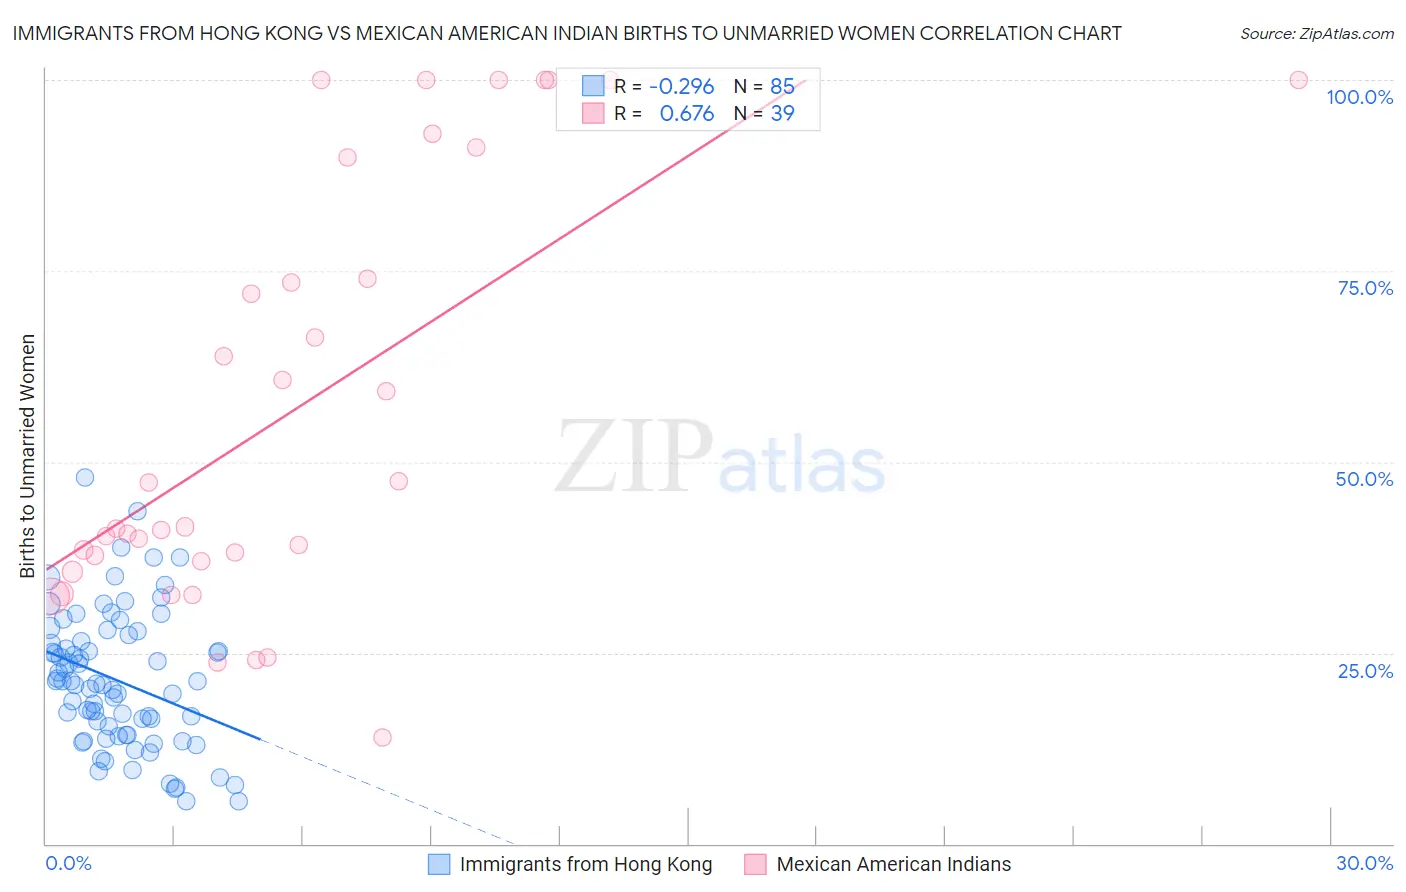
Immigrants from Hong Kong vs Mexican American Indian Births to Unmarried Women Correlation Chart
The statistical analysis conducted on geographies consisting of 239,354,992 people shows a weak negative correlation between the proportion of Immigrants from Hong Kong and percentage of births to unmarried women in the United States with a correlation coefficient (R) of -0.296 and weighted average of 23.6%. Similarly, the statistical analysis conducted on geographies consisting of 305,475,949 people shows a significant positive correlation between the proportion of Mexican American Indians and percentage of births to unmarried women in the United States with a correlation coefficient (R) of 0.676 and weighted average of 35.7%, a difference of 51.6%.
Births to Unmarried Women Correlation Summary
| Measurement | Immigrants from Hong Kong | Mexican American Indian |
| Minimum | 5.6% | 13.9% |
| Maximum | 48.0% | 100.0% |
| Range | 42.4% | 86.1% |
| Mean | 21.4% | 57.1% |
| Median | 21.0% | 41.5% |
| Interquartile 25% (IQ1) | 14.3% | 36.9% |
| Interquartile 75% (IQ3) | 26.9% | 89.8% |
| Interquartile Range (IQR) | 12.6% | 52.9% |
| Standard Deviation (Sample) | 8.9% | 27.6% |
| Standard Deviation (Population) | 8.8% | 27.2% |
Similar Demographics by Births to Unmarried Women
Demographics Similar to Immigrants from Hong Kong by Births to Unmarried Women
In terms of births to unmarried women, the demographic groups most similar to Immigrants from Hong Kong are Immigrants from Iran (24.0%, a difference of 1.6%), Thai (24.0%, a difference of 1.9%), Immigrants from Taiwan (23.0%, a difference of 2.5%), Filipino (23.0%, a difference of 2.6%), and Immigrants from India (22.9%, a difference of 3.0%).
| Demographics | Rating | Rank | Births to Unmarried Women |
| Assyrians/Chaldeans/Syriacs | 100.0 /100 | #1 | Exceptional 22.0% |
| Immigrants | India | 100.0 /100 | #2 | Exceptional 22.9% |
| Filipinos | 100.0 /100 | #3 | Exceptional 23.0% |
| Immigrants | Taiwan | 100.0 /100 | #4 | Exceptional 23.0% |
| Immigrants | Hong Kong | 100.0 /100 | #5 | Exceptional 23.6% |
| Immigrants | Iran | 100.0 /100 | #6 | Exceptional 24.0% |
| Thais | 100.0 /100 | #7 | Exceptional 24.0% |
| Immigrants | China | 100.0 /100 | #8 | Exceptional 24.7% |
| Immigrants | South Central Asia | 100.0 /100 | #9 | Exceptional 24.7% |
| Immigrants | Eastern Asia | 100.0 /100 | #10 | Exceptional 25.0% |
| Immigrants | Israel | 100.0 /100 | #11 | Exceptional 25.1% |
| Indians (Asian) | 100.0 /100 | #12 | Exceptional 25.3% |
| Iranians | 100.0 /100 | #13 | Exceptional 25.3% |
| Immigrants | Lebanon | 100.0 /100 | #14 | Exceptional 25.3% |
| Immigrants | Singapore | 100.0 /100 | #15 | Exceptional 25.6% |
Demographics Similar to Mexican American Indians by Births to Unmarried Women
In terms of births to unmarried women, the demographic groups most similar to Mexican American Indians are Immigrants from Western Africa (36.0%, a difference of 0.57%), Bermudan (35.5%, a difference of 0.61%), Nonimmigrants (35.5%, a difference of 0.62%), Salvadoran (36.0%, a difference of 0.69%), and Immigrants from Nigeria (35.4%, a difference of 0.96%).
| Demographics | Rating | Rank | Births to Unmarried Women |
| Japanese | 0.9 /100 | #243 | Tragic 35.2% |
| Guyanese | 0.9 /100 | #244 | Tragic 35.2% |
| Shoshone | 0.8 /100 | #245 | Tragic 35.3% |
| Nigerians | 0.7 /100 | #246 | Tragic 35.3% |
| Immigrants | Nigeria | 0.7 /100 | #247 | Tragic 35.4% |
| Immigrants | Nonimmigrants | 0.6 /100 | #248 | Tragic 35.5% |
| Bermudans | 0.6 /100 | #249 | Tragic 35.5% |
| Mexican American Indians | 0.4 /100 | #250 | Tragic 35.7% |
| Immigrants | Western Africa | 0.3 /100 | #251 | Tragic 36.0% |
| Salvadorans | 0.3 /100 | #252 | Tragic 36.0% |
| Immigrants | Portugal | 0.2 /100 | #253 | Tragic 36.2% |
| Potawatomi | 0.2 /100 | #254 | Tragic 36.2% |
| Chickasaw | 0.2 /100 | #255 | Tragic 36.3% |
| Immigrants | Trinidad and Tobago | 0.2 /100 | #256 | Tragic 36.3% |
| Immigrants | Grenada | 0.2 /100 | #257 | Tragic 36.3% |