Immigrants from Zimbabwe vs Polish Female Poverty
COMPARE
Immigrants from Zimbabwe
Polish
Female Poverty
Female Poverty Comparison
Immigrants from Zimbabwe
Poles
12.6%
FEMALE POVERTY
93.1/ 100
METRIC RATING
109th/ 347
METRIC RANK
11.7%
FEMALE POVERTY
99.5/ 100
METRIC RATING
31st/ 347
METRIC RANK
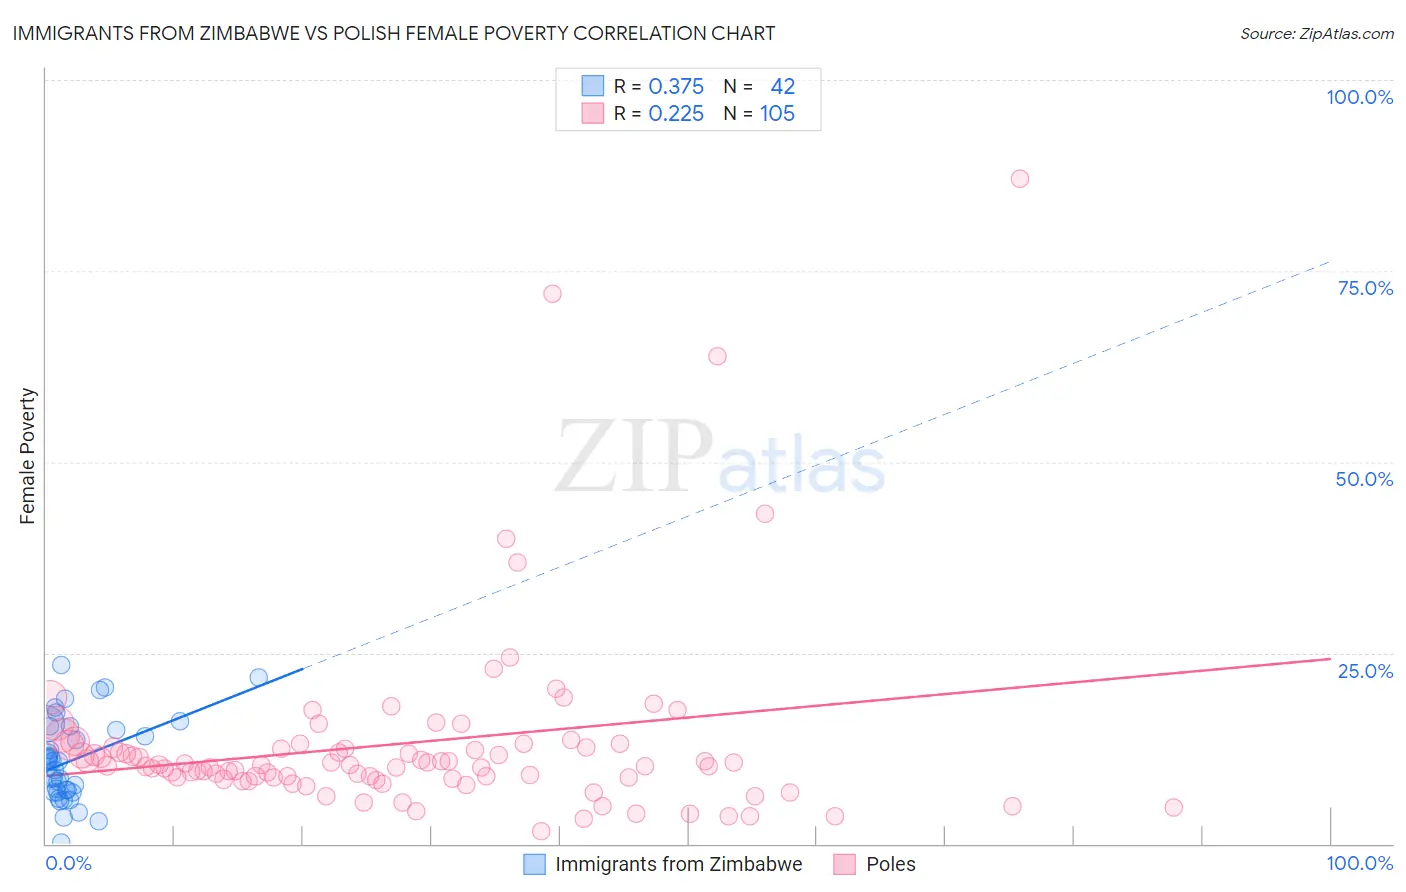
Immigrants from Zimbabwe vs Polish Female Poverty Correlation Chart
The statistical analysis conducted on geographies consisting of 117,784,385 people shows a mild positive correlation between the proportion of Immigrants from Zimbabwe and poverty level among females in the United States with a correlation coefficient (R) of 0.375 and weighted average of 12.6%. Similarly, the statistical analysis conducted on geographies consisting of 559,323,396 people shows a weak positive correlation between the proportion of Poles and poverty level among females in the United States with a correlation coefficient (R) of 0.225 and weighted average of 11.7%, a difference of 7.4%.
Female Poverty Correlation Summary
| Measurement | Immigrants from Zimbabwe | Polish |
| Minimum | 0.23% | 1.6% |
| Maximum | 23.3% | 87.1% |
| Range | 23.1% | 85.5% |
| Mean | 11.0% | 13.1% |
| Median | 10.8% | 10.3% |
| Interquartile 25% (IQ1) | 6.7% | 8.6% |
| Interquartile 75% (IQ3) | 15.3% | 12.8% |
| Interquartile Range (IQR) | 8.6% | 4.3% |
| Standard Deviation (Sample) | 5.5% | 12.4% |
| Standard Deviation (Population) | 5.4% | 12.4% |
Similar Demographics by Female Poverty
Demographics Similar to Immigrants from Zimbabwe by Female Poverty
In terms of female poverty, the demographic groups most similar to Immigrants from Zimbabwe are Portuguese (12.6%, a difference of 0.020%), Paraguayan (12.6%, a difference of 0.030%), Laotian (12.6%, a difference of 0.12%), Soviet Union (12.6%, a difference of 0.25%), and Immigrants from Turkey (12.6%, a difference of 0.31%).
| Demographics | Rating | Rank | Female Poverty |
| Immigrants | China | 94.5 /100 | #102 | Exceptional 12.5% |
| Slavs | 94.5 /100 | #103 | Exceptional 12.5% |
| Palestinians | 94.3 /100 | #104 | Exceptional 12.5% |
| Scottish | 94.1 /100 | #105 | Exceptional 12.5% |
| Immigrants | Turkey | 93.8 /100 | #106 | Exceptional 12.6% |
| Laotians | 93.4 /100 | #107 | Exceptional 12.6% |
| Portuguese | 93.1 /100 | #108 | Exceptional 12.6% |
| Immigrants | Zimbabwe | 93.1 /100 | #109 | Exceptional 12.6% |
| Paraguayans | 93.0 /100 | #110 | Exceptional 12.6% |
| Soviet Union | 92.4 /100 | #111 | Exceptional 12.6% |
| Immigrants | Israel | 92.0 /100 | #112 | Exceptional 12.6% |
| Canadians | 92.0 /100 | #113 | Exceptional 12.7% |
| Welsh | 91.6 /100 | #114 | Exceptional 12.7% |
| Puget Sound Salish | 91.5 /100 | #115 | Exceptional 12.7% |
| Immigrants | Russia | 91.2 /100 | #116 | Exceptional 12.7% |
Demographics Similar to Poles by Female Poverty
In terms of female poverty, the demographic groups most similar to Poles are Danish (11.7%, a difference of 0.13%), Cypriot (11.8%, a difference of 0.21%), Greek (11.7%, a difference of 0.22%), Immigrants from North Macedonia (11.7%, a difference of 0.30%), and Immigrants from Singapore (11.8%, a difference of 0.32%).
| Demographics | Rating | Rank | Female Poverty |
| Luxembourgers | 99.7 /100 | #24 | Exceptional 11.6% |
| Immigrants | Northern Europe | 99.6 /100 | #25 | Exceptional 11.6% |
| Croatians | 99.6 /100 | #26 | Exceptional 11.6% |
| Iranians | 99.6 /100 | #27 | Exceptional 11.7% |
| Immigrants | Korea | 99.6 /100 | #28 | Exceptional 11.7% |
| Immigrants | North Macedonia | 99.6 /100 | #29 | Exceptional 11.7% |
| Greeks | 99.5 /100 | #30 | Exceptional 11.7% |
| Poles | 99.5 /100 | #31 | Exceptional 11.7% |
| Danes | 99.5 /100 | #32 | Exceptional 11.7% |
| Cypriots | 99.5 /100 | #33 | Exceptional 11.8% |
| Immigrants | Singapore | 99.4 /100 | #34 | Exceptional 11.8% |
| Immigrants | Iran | 99.4 /100 | #35 | Exceptional 11.8% |
| Immigrants | Pakistan | 99.4 /100 | #36 | Exceptional 11.8% |
| Immigrants | Greece | 99.3 /100 | #37 | Exceptional 11.8% |
| Russians | 99.3 /100 | #38 | Exceptional 11.8% |