Immigrants from Guyana vs Immigrants from West Indies Single Male Poverty
COMPARE
Immigrants from Guyana
Immigrants from West Indies
Single Male Poverty
Single Male Poverty Comparison
Immigrants from Guyana
Immigrants from West Indies
12.7%
SINGLE MALE POVERTY
60.5/ 100
METRIC RATING
166th/ 347
METRIC RANK
12.9%
SINGLE MALE POVERTY
33.0/ 100
METRIC RATING
183rd/ 347
METRIC RANK
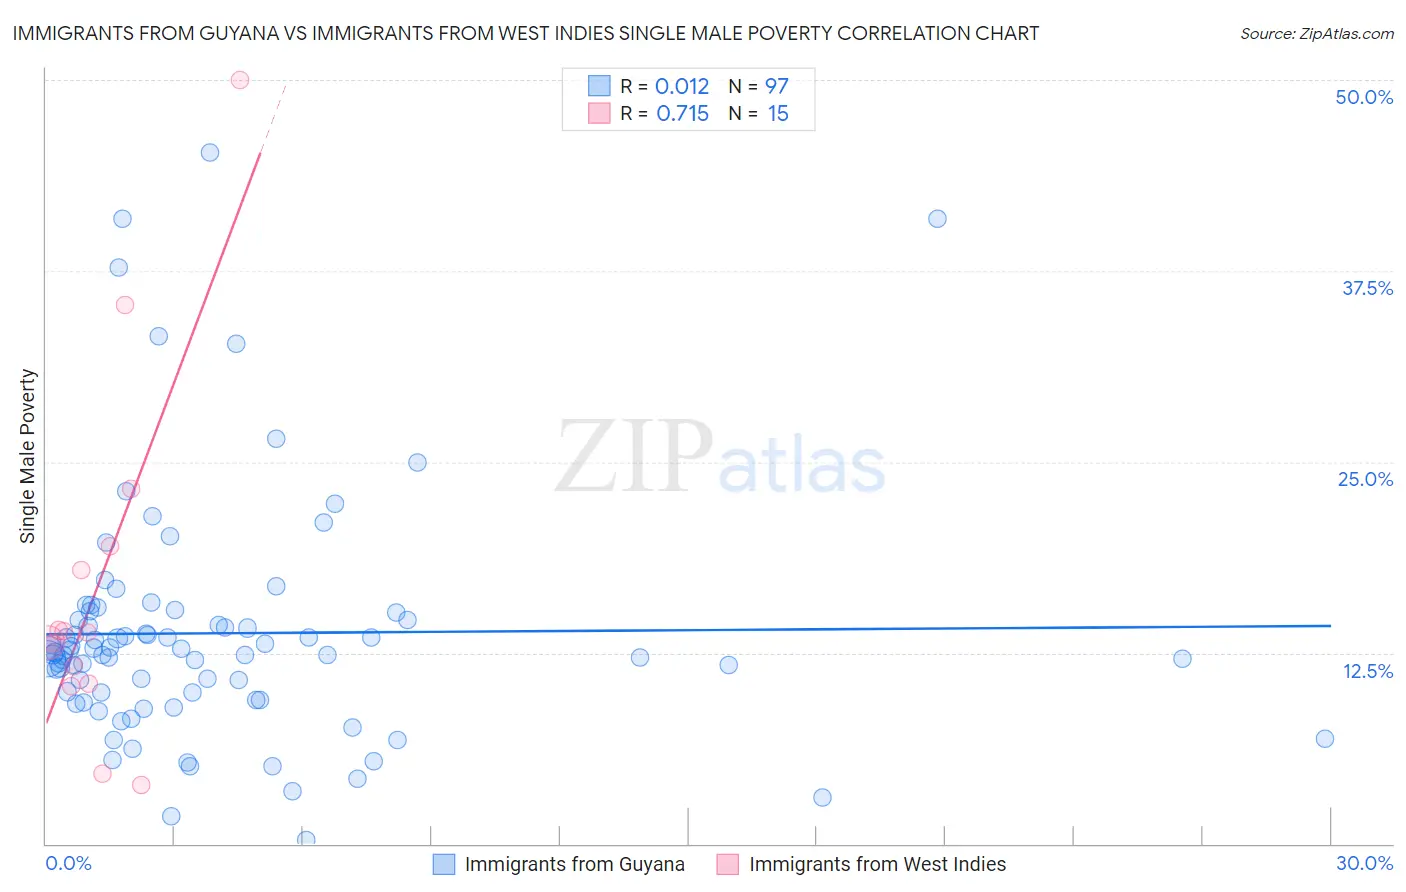
Immigrants from Guyana vs Immigrants from West Indies Single Male Poverty Correlation Chart
The statistical analysis conducted on geographies consisting of 169,877,868 people shows no correlation between the proportion of Immigrants from Guyana and poverty level among single males in the United States with a correlation coefficient (R) of 0.012 and weighted average of 12.7%. Similarly, the statistical analysis conducted on geographies consisting of 70,729,922 people shows a strong positive correlation between the proportion of Immigrants from West Indies and poverty level among single males in the United States with a correlation coefficient (R) of 0.715 and weighted average of 12.9%, a difference of 1.5%.
Single Male Poverty Correlation Summary
| Measurement | Immigrants from Guyana | Immigrants from West Indies |
| Minimum | 0.23% | 3.8% |
| Maximum | 45.3% | 50.0% |
| Range | 45.1% | 46.2% |
| Mean | 13.8% | 17.0% |
| Median | 12.6% | 13.8% |
| Interquartile 25% (IQ1) | 9.7% | 10.5% |
| Interquartile 75% (IQ3) | 14.9% | 19.5% |
| Interquartile Range (IQR) | 5.2% | 9.0% |
| Standard Deviation (Sample) | 7.9% | 11.9% |
| Standard Deviation (Population) | 7.9% | 11.5% |
Demographics Similar to Immigrants from Guyana and Immigrants from West Indies by Single Male Poverty
In terms of single male poverty, the demographic groups most similar to Immigrants from Guyana are Immigrants from Cambodia (12.7%, a difference of 0.090%), Immigrants from Nigeria (12.7%, a difference of 0.13%), Immigrants from Sudan (12.7%, a difference of 0.13%), Immigrants from Barbados (12.7%, a difference of 0.15%), and Puget Sound Salish (12.8%, a difference of 0.34%). Similarly, the demographic groups most similar to Immigrants from West Indies are Immigrants from Trinidad and Tobago (12.9%, a difference of 0.030%), Moroccan (12.9%, a difference of 0.22%), Panamanian (12.9%, a difference of 0.26%), Immigrants from North America (12.9%, a difference of 0.27%), and Israeli (12.9%, a difference of 0.45%).
| Demographics | Rating | Rank | Single Male Poverty |
| Immigrants | Nigeria | 62.8 /100 | #164 | Good 12.7% |
| Immigrants | Cambodia | 62.2 /100 | #165 | Good 12.7% |
| Immigrants | Guyana | 60.5 /100 | #166 | Good 12.7% |
| Immigrants | Sudan | 58.2 /100 | #167 | Average 12.7% |
| Immigrants | Barbados | 57.7 /100 | #168 | Average 12.7% |
| Puget Sound Salish | 54.3 /100 | #169 | Average 12.8% |
| Guyanese | 52.0 /100 | #170 | Average 12.8% |
| South Africans | 51.5 /100 | #171 | Average 12.8% |
| Danes | 51.4 /100 | #172 | Average 12.8% |
| Immigrants | St. Vincent and the Grenadines | 50.9 /100 | #173 | Average 12.8% |
| Costa Ricans | 50.0 /100 | #174 | Average 12.8% |
| Croatians | 48.9 /100 | #175 | Average 12.8% |
| Syrians | 48.4 /100 | #176 | Average 12.8% |
| Immigrants | Canada | 44.8 /100 | #177 | Average 12.8% |
| Immigrants | Switzerland | 43.1 /100 | #178 | Average 12.8% |
| Israelis | 41.0 /100 | #179 | Average 12.9% |
| Immigrants | North America | 37.7 /100 | #180 | Fair 12.9% |
| Panamanians | 37.6 /100 | #181 | Fair 12.9% |
| Moroccans | 36.8 /100 | #182 | Fair 12.9% |
| Immigrants | West Indies | 33.0 /100 | #183 | Fair 12.9% |
| Immigrants | Trinidad and Tobago | 32.5 /100 | #184 | Fair 12.9% |