Immigrants from Guyana vs Asian Single Male Poverty
COMPARE
Immigrants from Guyana
Asian
Single Male Poverty
Single Male Poverty Comparison
Immigrants from Guyana
Asians
12.7%
SINGLE MALE POVERTY
60.5/ 100
METRIC RATING
166th/ 347
METRIC RANK
11.2%
SINGLE MALE POVERTY
100.0/ 100
METRIC RATING
21st/ 347
METRIC RANK
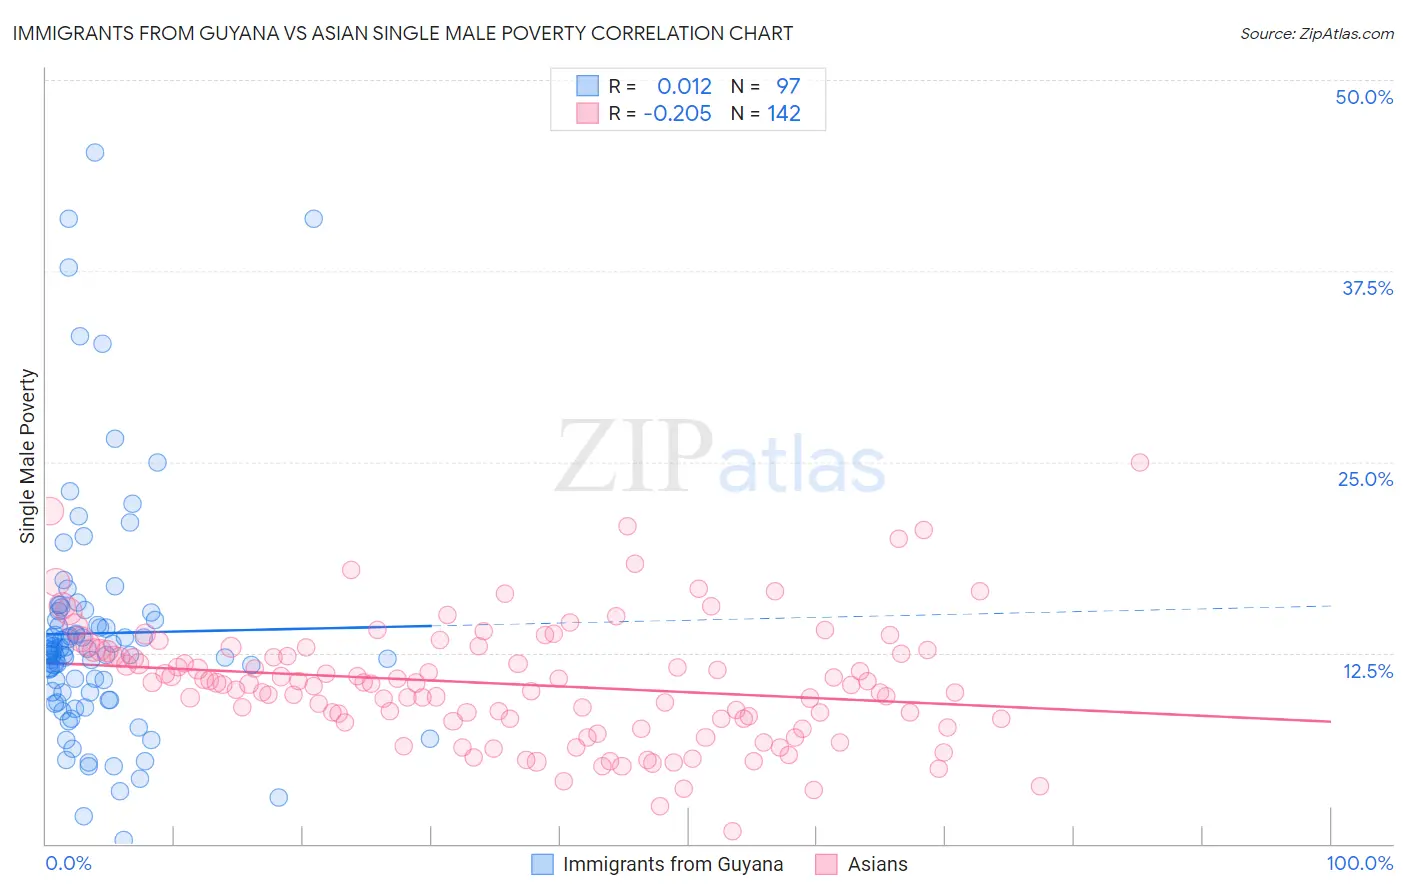
Immigrants from Guyana vs Asian Single Male Poverty Correlation Chart
The statistical analysis conducted on geographies consisting of 169,877,868 people shows no correlation between the proportion of Immigrants from Guyana and poverty level among single males in the United States with a correlation coefficient (R) of 0.012 and weighted average of 12.7%. Similarly, the statistical analysis conducted on geographies consisting of 462,594,480 people shows a weak negative correlation between the proportion of Asians and poverty level among single males in the United States with a correlation coefficient (R) of -0.205 and weighted average of 11.2%, a difference of 13.6%.
Single Male Poverty Correlation Summary
| Measurement | Immigrants from Guyana | Asian |
| Minimum | 0.23% | 0.83% |
| Maximum | 45.3% | 25.0% |
| Range | 45.1% | 24.2% |
| Mean | 13.8% | 10.5% |
| Median | 12.6% | 10.5% |
| Interquartile 25% (IQ1) | 9.7% | 8.1% |
| Interquartile 75% (IQ3) | 14.9% | 12.7% |
| Interquartile Range (IQR) | 5.2% | 4.6% |
| Standard Deviation (Sample) | 7.9% | 4.0% |
| Standard Deviation (Population) | 7.9% | 4.0% |
Similar Demographics by Single Male Poverty
Demographics Similar to Immigrants from Guyana by Single Male Poverty
In terms of single male poverty, the demographic groups most similar to Immigrants from Guyana are Immigrants from Cambodia (12.7%, a difference of 0.090%), Immigrants from Nigeria (12.7%, a difference of 0.13%), Immigrants from Sudan (12.7%, a difference of 0.13%), Palestinian (12.7%, a difference of 0.14%), and Immigrants from Barbados (12.7%, a difference of 0.15%).
| Demographics | Rating | Rank | Single Male Poverty |
| Immigrants | Liberia | 64.2 /100 | #159 | Good 12.7% |
| Greeks | 64.1 /100 | #160 | Good 12.7% |
| Immigrants | Africa | 63.4 /100 | #161 | Good 12.7% |
| Eastern Europeans | 63.3 /100 | #162 | Good 12.7% |
| Palestinians | 63.1 /100 | #163 | Good 12.7% |
| Immigrants | Nigeria | 62.8 /100 | #164 | Good 12.7% |
| Immigrants | Cambodia | 62.2 /100 | #165 | Good 12.7% |
| Immigrants | Guyana | 60.5 /100 | #166 | Good 12.7% |
| Immigrants | Sudan | 58.2 /100 | #167 | Average 12.7% |
| Immigrants | Barbados | 57.7 /100 | #168 | Average 12.7% |
| Puget Sound Salish | 54.3 /100 | #169 | Average 12.8% |
| Guyanese | 52.0 /100 | #170 | Average 12.8% |
| South Africans | 51.5 /100 | #171 | Average 12.8% |
| Danes | 51.4 /100 | #172 | Average 12.8% |
| Immigrants | St. Vincent and the Grenadines | 50.9 /100 | #173 | Average 12.8% |
Demographics Similar to Asians by Single Male Poverty
In terms of single male poverty, the demographic groups most similar to Asians are Immigrants from Pakistan (11.2%, a difference of 0.090%), Bolivian (11.2%, a difference of 0.30%), Ethiopian (11.2%, a difference of 0.34%), Immigrants from Moldova (11.2%, a difference of 0.37%), and Indian (Asian) (11.3%, a difference of 0.50%).
| Demographics | Rating | Rank | Single Male Poverty |
| Chinese | 100.0 /100 | #14 | Exceptional 11.0% |
| Koreans | 100.0 /100 | #15 | Exceptional 11.0% |
| Bhutanese | 100.0 /100 | #16 | Exceptional 11.1% |
| Tsimshian | 100.0 /100 | #17 | Exceptional 11.1% |
| Immigrants | Bolivia | 100.0 /100 | #18 | Exceptional 11.1% |
| Immigrants | Moldova | 100.0 /100 | #19 | Exceptional 11.2% |
| Ethiopians | 100.0 /100 | #20 | Exceptional 11.2% |
| Asians | 100.0 /100 | #21 | Exceptional 11.2% |
| Immigrants | Pakistan | 100.0 /100 | #22 | Exceptional 11.2% |
| Bolivians | 100.0 /100 | #23 | Exceptional 11.2% |
| Indians (Asian) | 100.0 /100 | #24 | Exceptional 11.3% |
| Maltese | 100.0 /100 | #25 | Exceptional 11.3% |
| Immigrants | Japan | 100.0 /100 | #26 | Exceptional 11.3% |
| Immigrants | China | 100.0 /100 | #27 | Exceptional 11.4% |
| Immigrants | Asia | 100.0 /100 | #28 | Exceptional 11.4% |