Immigrants from Guyana vs Tsimshian Receiving Food Stamps
COMPARE
Immigrants from Guyana
Tsimshian
Receiving Food Stamps
Receiving Food Stamps Comparison
Immigrants from Guyana
Tsimshian
16.9%
RECEIVING FOOD STAMPS
0.0/ 100
METRIC RATING
314th/ 347
METRIC RANK
15.7%
RECEIVING FOOD STAMPS
0.0/ 100
METRIC RATING
296th/ 347
METRIC RANK
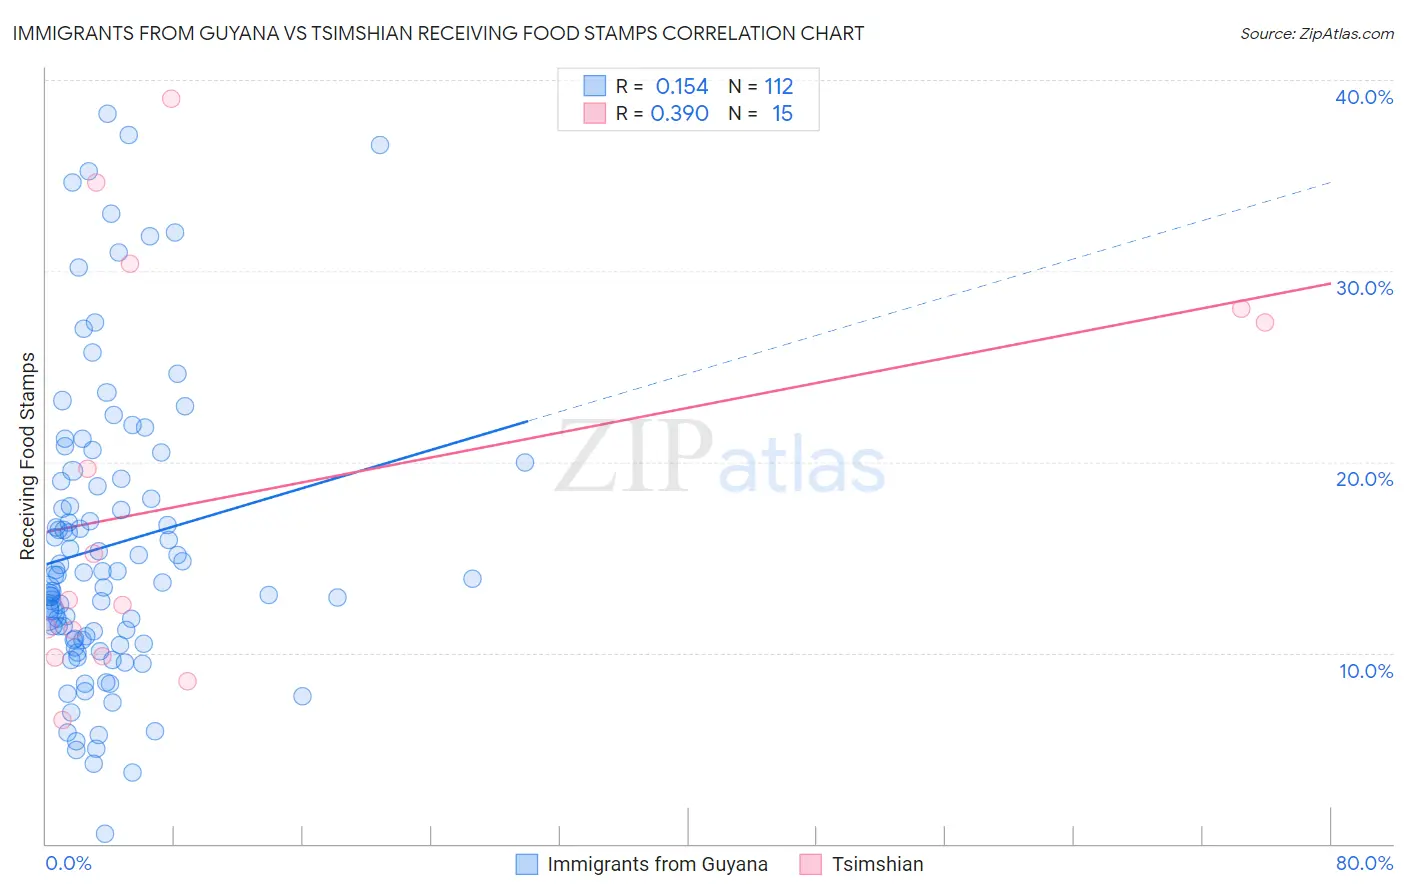
Immigrants from Guyana vs Tsimshian Receiving Food Stamps Correlation Chart
The statistical analysis conducted on geographies consisting of 183,583,231 people shows a poor positive correlation between the proportion of Immigrants from Guyana and percentage of population receiving government assistance and/or food stamps in the United States with a correlation coefficient (R) of 0.154 and weighted average of 16.9%. Similarly, the statistical analysis conducted on geographies consisting of 15,626,544 people shows a mild positive correlation between the proportion of Tsimshian and percentage of population receiving government assistance and/or food stamps in the United States with a correlation coefficient (R) of 0.390 and weighted average of 15.7%, a difference of 7.5%.
Receiving Food Stamps Correlation Summary
| Measurement | Immigrants from Guyana | Tsimshian |
| Minimum | 0.50% | 6.5% |
| Maximum | 38.2% | 39.0% |
| Range | 37.7% | 32.5% |
| Mean | 15.6% | 18.4% |
| Median | 14.0% | 12.8% |
| Interquartile 25% (IQ1) | 10.7% | 9.8% |
| Interquartile 75% (IQ3) | 19.1% | 28.0% |
| Interquartile Range (IQR) | 8.4% | 18.2% |
| Standard Deviation (Sample) | 7.8% | 10.6% |
| Standard Deviation (Population) | 7.7% | 10.2% |
Demographics Similar to Immigrants from Guyana and Tsimshian by Receiving Food Stamps
In terms of receiving food stamps, the demographic groups most similar to Immigrants from Guyana are Immigrants from Jamaica (16.9%, a difference of 0.17%), Sioux (16.8%, a difference of 0.45%), Bahamian (17.0%, a difference of 0.57%), Guyanese (16.7%, a difference of 1.2%), and Immigrants from Barbados (16.6%, a difference of 1.7%). Similarly, the demographic groups most similar to Tsimshian are Immigrants from Honduras (15.7%, a difference of 0.010%), Immigrants from Bahamas (15.8%, a difference of 0.16%), Immigrants from Trinidad and Tobago (15.8%, a difference of 0.41%), Hispanic or Latino (15.8%, a difference of 0.69%), and Immigrants from Bangladesh (15.9%, a difference of 1.1%).
| Demographics | Rating | Rank | Receiving Food Stamps |
| Immigrants | Honduras | 0.0 /100 | #295 | Tragic 15.7% |
| Tsimshian | 0.0 /100 | #296 | Tragic 15.7% |
| Immigrants | Bahamas | 0.0 /100 | #297 | Tragic 15.8% |
| Immigrants | Trinidad and Tobago | 0.0 /100 | #298 | Tragic 15.8% |
| Hispanics or Latinos | 0.0 /100 | #299 | Tragic 15.8% |
| Immigrants | Bangladesh | 0.0 /100 | #300 | Tragic 15.9% |
| Trinidadians and Tobagonians | 0.0 /100 | #301 | Tragic 16.0% |
| Immigrants | West Indies | 0.0 /100 | #302 | Tragic 16.1% |
| Nicaraguans | 0.0 /100 | #303 | Tragic 16.1% |
| West Indians | 0.0 /100 | #304 | Tragic 16.3% |
| Immigrants | Azores | 0.0 /100 | #305 | Tragic 16.4% |
| Jamaicans | 0.0 /100 | #306 | Tragic 16.4% |
| Houma | 0.0 /100 | #307 | Tragic 16.5% |
| Barbadians | 0.0 /100 | #308 | Tragic 16.5% |
| U.S. Virgin Islanders | 0.0 /100 | #309 | Tragic 16.5% |
| Immigrants | Barbados | 0.0 /100 | #310 | Tragic 16.6% |
| Guyanese | 0.0 /100 | #311 | Tragic 16.7% |
| Sioux | 0.0 /100 | #312 | Tragic 16.8% |
| Immigrants | Jamaica | 0.0 /100 | #313 | Tragic 16.9% |
| Immigrants | Guyana | 0.0 /100 | #314 | Tragic 16.9% |
| Bahamians | 0.0 /100 | #315 | Tragic 17.0% |