Immigrants from Guyana vs Alaskan Athabascan Family Households with Children
COMPARE
Immigrants from Guyana
Alaskan Athabascan
Family Households with Children
Family Households with Children Comparison
Immigrants from Guyana
Alaskan Athabascans
26.3%
FAMILY HOUSEHOLDS WITH CHILDREN
0.1/ 100
METRIC RATING
303rd/ 347
METRIC RANK
27.6%
FAMILY HOUSEHOLDS WITH CHILDREN
67.1/ 100
METRIC RATING
161st/ 347
METRIC RANK
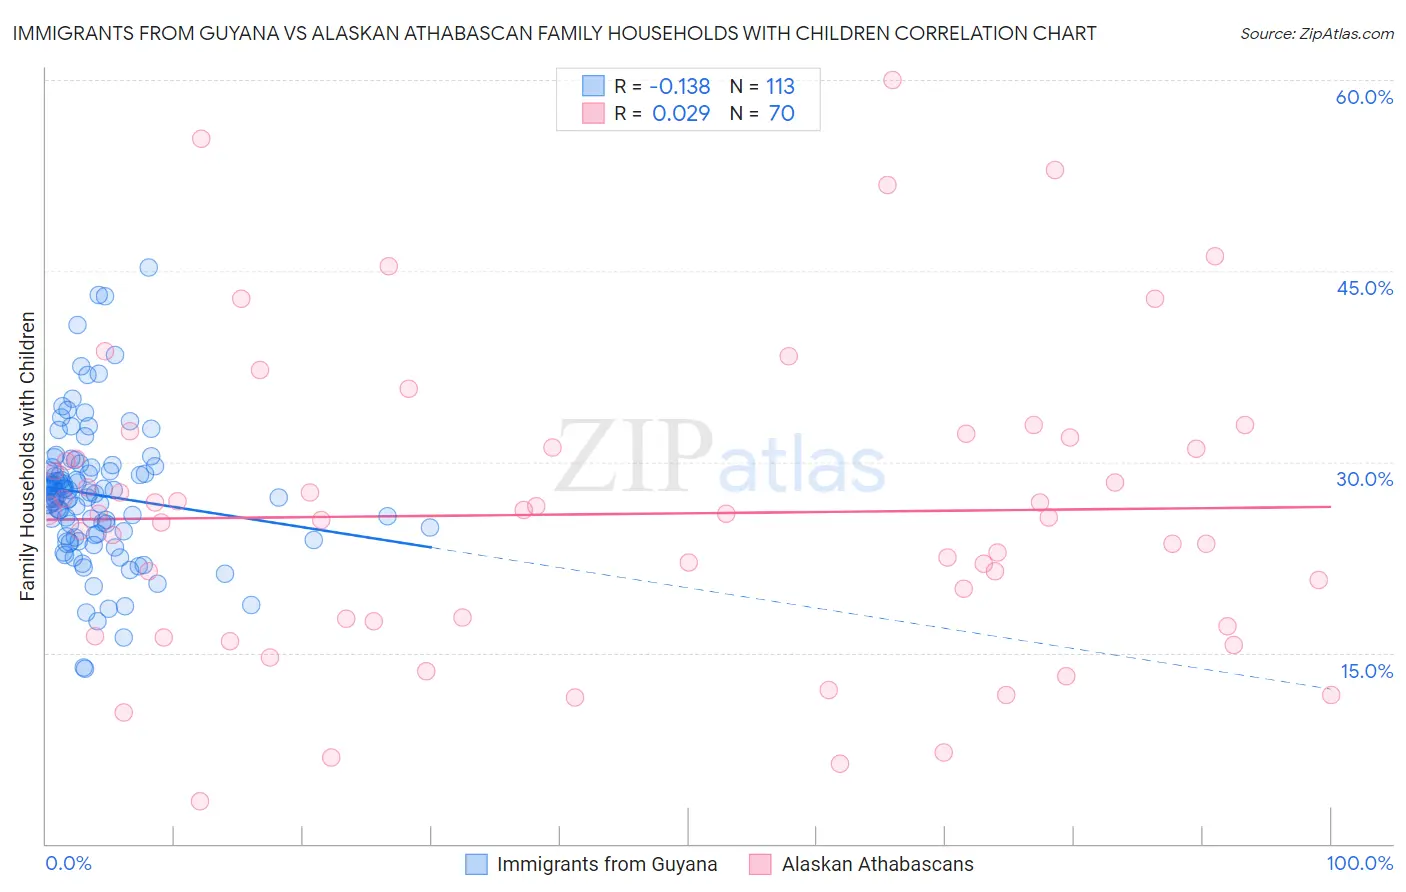
Immigrants from Guyana vs Alaskan Athabascan Family Households with Children Correlation Chart
The statistical analysis conducted on geographies consisting of 183,626,944 people shows a poor negative correlation between the proportion of Immigrants from Guyana and percentage of family households with children in the United States with a correlation coefficient (R) of -0.138 and weighted average of 26.3%. Similarly, the statistical analysis conducted on geographies consisting of 45,814,006 people shows no correlation between the proportion of Alaskan Athabascans and percentage of family households with children in the United States with a correlation coefficient (R) of 0.029 and weighted average of 27.6%, a difference of 4.6%.
Family Households with Children Correlation Summary
| Measurement | Immigrants from Guyana | Alaskan Athabascan |
| Minimum | 13.8% | 3.3% |
| Maximum | 45.3% | 60.0% |
| Range | 31.5% | 56.7% |
| Mean | 27.4% | 25.9% |
| Median | 27.3% | 25.8% |
| Interquartile 25% (IQ1) | 24.2% | 17.5% |
| Interquartile 75% (IQ3) | 29.6% | 31.1% |
| Interquartile Range (IQR) | 5.4% | 13.6% |
| Standard Deviation (Sample) | 5.5% | 11.8% |
| Standard Deviation (Population) | 5.5% | 11.7% |
Similar Demographics by Family Households with Children
Demographics Similar to Immigrants from Guyana by Family Households with Children
In terms of family households with children, the demographic groups most similar to Immigrants from Guyana are Serbian (26.4%, a difference of 0.030%), Immigrants from Trinidad and Tobago (26.4%, a difference of 0.040%), Immigrants from Bahamas (26.3%, a difference of 0.050%), Paiute (26.4%, a difference of 0.060%), and Guyanese (26.3%, a difference of 0.080%).
| Demographics | Rating | Rank | Family Households with Children |
| Croatians | 0.1 /100 | #296 | Tragic 26.4% |
| Armenians | 0.1 /100 | #297 | Tragic 26.4% |
| Immigrants | Western Europe | 0.1 /100 | #298 | Tragic 26.4% |
| Trinidadians and Tobagonians | 0.1 /100 | #299 | Tragic 26.4% |
| Paiute | 0.1 /100 | #300 | Tragic 26.4% |
| Immigrants | Trinidad and Tobago | 0.1 /100 | #301 | Tragic 26.4% |
| Serbians | 0.1 /100 | #302 | Tragic 26.4% |
| Immigrants | Guyana | 0.1 /100 | #303 | Tragic 26.3% |
| Immigrants | Bahamas | 0.1 /100 | #304 | Tragic 26.3% |
| Guyanese | 0.1 /100 | #305 | Tragic 26.3% |
| Bermudans | 0.1 /100 | #306 | Tragic 26.3% |
| West Indians | 0.0 /100 | #307 | Tragic 26.3% |
| Lumbee | 0.0 /100 | #308 | Tragic 26.3% |
| Immigrants | Somalia | 0.0 /100 | #309 | Tragic 26.3% |
| Marshallese | 0.0 /100 | #310 | Tragic 26.2% |
Demographics Similar to Alaskan Athabascans by Family Households with Children
In terms of family households with children, the demographic groups most similar to Alaskan Athabascans are Immigrants from Bangladesh (27.6%, a difference of 0.0%), Subsaharan African (27.6%, a difference of 0.010%), Czech (27.5%, a difference of 0.040%), Immigrants from Hong Kong (27.5%, a difference of 0.050%), and Romanian (27.6%, a difference of 0.090%).
| Demographics | Rating | Rank | Family Households with Children |
| Icelanders | 75.3 /100 | #154 | Good 27.6% |
| Comanche | 74.8 /100 | #155 | Good 27.6% |
| Hungarians | 74.6 /100 | #156 | Good 27.6% |
| Indians (Asian) | 71.6 /100 | #157 | Good 27.6% |
| Romanians | 70.8 /100 | #158 | Good 27.6% |
| Mongolians | 70.7 /100 | #159 | Good 27.6% |
| Sub-Saharan Africans | 67.5 /100 | #160 | Good 27.6% |
| Alaskan Athabascans | 67.1 /100 | #161 | Good 27.6% |
| Immigrants | Bangladesh | 67.0 /100 | #162 | Good 27.6% |
| Czechs | 65.3 /100 | #163 | Good 27.5% |
| Immigrants | Hong Kong | 64.9 /100 | #164 | Good 27.5% |
| Immigrants | South Africa | 61.3 /100 | #165 | Good 27.5% |
| Immigrants | Nonimmigrants | 61.2 /100 | #166 | Good 27.5% |
| Dominicans | 61.1 /100 | #167 | Good 27.5% |
| Immigrants | Kuwait | 60.9 /100 | #168 | Good 27.5% |