Immigrants from Guyana vs Alaskan Athabascan Median Family Income
COMPARE
Immigrants from Guyana
Alaskan Athabascan
Median Family Income
Median Family Income Comparison
Immigrants from Guyana
Alaskan Athabascans
$92,513
MEDIAN FAMILY INCOME
0.6/ 100
METRIC RATING
253rd/ 347
METRIC RANK
$94,429
MEDIAN FAMILY INCOME
1.5/ 100
METRIC RATING
237th/ 347
METRIC RANK
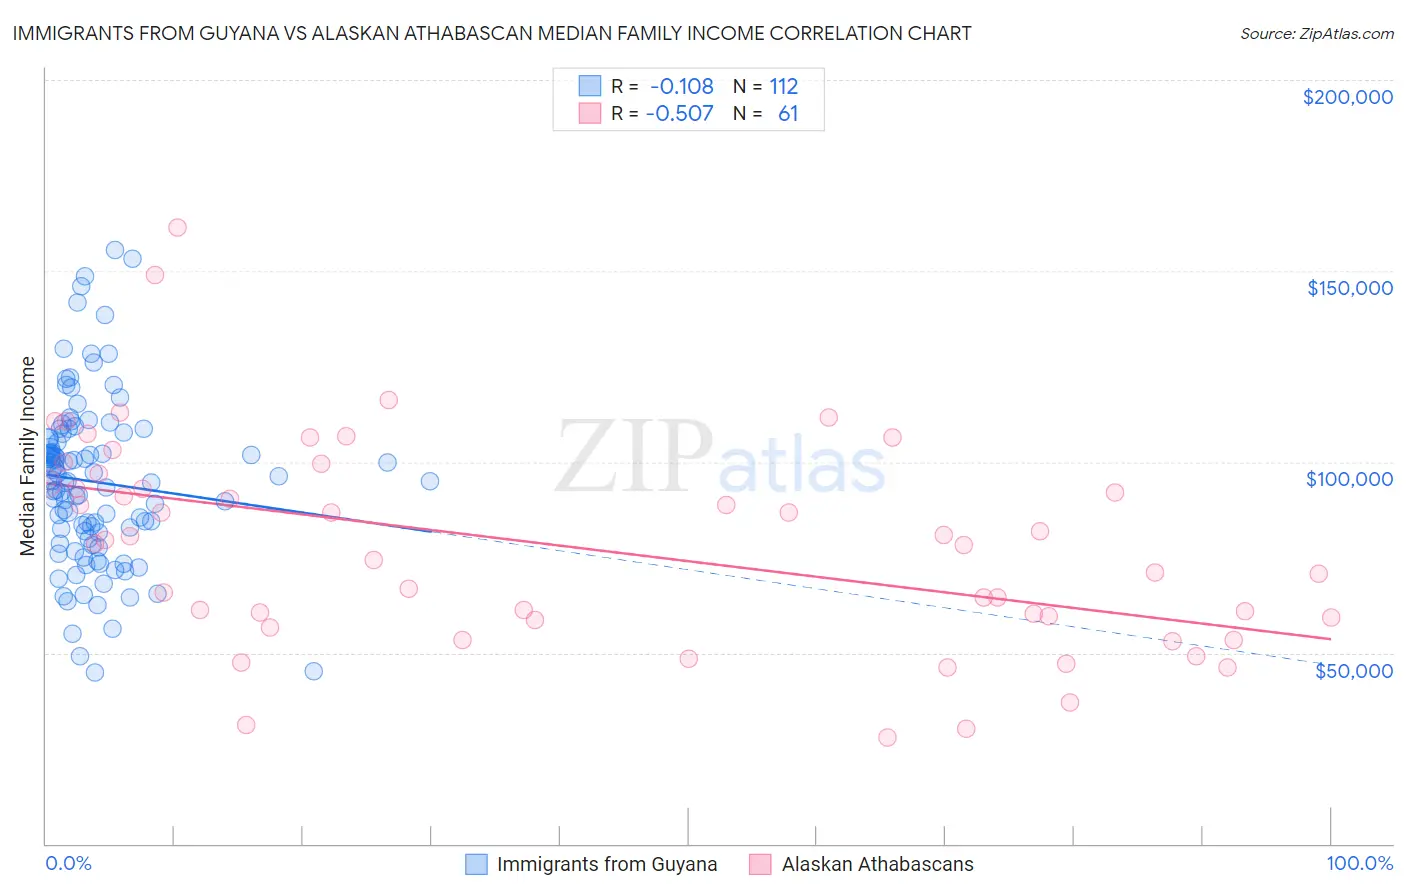
Immigrants from Guyana vs Alaskan Athabascan Median Family Income Correlation Chart
The statistical analysis conducted on geographies consisting of 183,650,317 people shows a poor negative correlation between the proportion of Immigrants from Guyana and median family income in the United States with a correlation coefficient (R) of -0.108 and weighted average of $92,513. Similarly, the statistical analysis conducted on geographies consisting of 45,809,380 people shows a substantial negative correlation between the proportion of Alaskan Athabascans and median family income in the United States with a correlation coefficient (R) of -0.507 and weighted average of $94,429, a difference of 2.1%.
Median Family Income Correlation Summary
| Measurement | Immigrants from Guyana | Alaskan Athabascan |
| Minimum | $44,715 | $27,750 |
| Maximum | $155,346 | $161,458 |
| Range | $110,631 | $133,708 |
| Mean | $94,705 | $77,954 |
| Median | $94,807 | $78,665 |
| Interquartile 25% (IQ1) | $80,722 | $58,765 |
| Interquartile 75% (IQ3) | $106,748 | $95,601 |
| Interquartile Range (IQR) | $26,026 | $36,836 |
| Standard Deviation (Sample) | $22,061 | $27,325 |
| Standard Deviation (Population) | $21,962 | $27,100 |
Demographics Similar to Immigrants from Guyana and Alaskan Athabascans by Median Family Income
In terms of median family income, the demographic groups most similar to Immigrants from Guyana are Immigrants from El Salvador ($92,545, a difference of 0.030%), Immigrants from Somalia ($92,609, a difference of 0.10%), Immigrants from Barbados ($92,419, a difference of 0.10%), West Indian ($92,765, a difference of 0.27%), and Immigrants from Laos ($92,239, a difference of 0.30%). Similarly, the demographic groups most similar to Alaskan Athabascans are Immigrants from Burma/Myanmar ($94,472, a difference of 0.040%), Trinidadian and Tobagonian ($94,466, a difference of 0.040%), Nepalese ($94,153, a difference of 0.29%), Salvadoran ($94,109, a difference of 0.34%), and Somali ($94,085, a difference of 0.37%).
| Demographics | Rating | Rank | Median Family Income |
| Immigrants | Burma/Myanmar | 1.5 /100 | #235 | Tragic $94,472 |
| Trinidadians and Tobagonians | 1.5 /100 | #236 | Tragic $94,466 |
| Alaskan Athabascans | 1.5 /100 | #237 | Tragic $94,429 |
| Nepalese | 1.3 /100 | #238 | Tragic $94,153 |
| Salvadorans | 1.2 /100 | #239 | Tragic $94,109 |
| Somalis | 1.2 /100 | #240 | Tragic $94,085 |
| Immigrants | Trinidad and Tobago | 1.2 /100 | #241 | Tragic $93,988 |
| Barbadians | 1.1 /100 | #242 | Tragic $93,919 |
| German Russians | 1.1 /100 | #243 | Tragic $93,858 |
| Sub-Saharan Africans | 1.0 /100 | #244 | Tragic $93,748 |
| Immigrants | Middle Africa | 1.0 /100 | #245 | Tragic $93,593 |
| Guyanese | 0.9 /100 | #246 | Tragic $93,373 |
| Immigrants | Senegal | 0.7 /100 | #247 | Tragic $92,912 |
| French American Indians | 0.7 /100 | #248 | Tragic $92,872 |
| Immigrants | Ecuador | 0.7 /100 | #249 | Tragic $92,837 |
| West Indians | 0.6 /100 | #250 | Tragic $92,765 |
| Immigrants | Somalia | 0.6 /100 | #251 | Tragic $92,609 |
| Immigrants | El Salvador | 0.6 /100 | #252 | Tragic $92,545 |
| Immigrants | Guyana | 0.6 /100 | #253 | Tragic $92,513 |
| Immigrants | Barbados | 0.5 /100 | #254 | Tragic $92,419 |
| Immigrants | Laos | 0.5 /100 | #255 | Tragic $92,239 |