Immigrants from Guyana vs Estonian Receiving Food Stamps
COMPARE
Immigrants from Guyana
Estonian
Receiving Food Stamps
Receiving Food Stamps Comparison
Immigrants from Guyana
Estonians
16.9%
RECEIVING FOOD STAMPS
0.0/ 100
METRIC RATING
314th/ 347
METRIC RANK
9.5%
RECEIVING FOOD STAMPS
99.6/ 100
METRIC RATING
36th/ 347
METRIC RANK
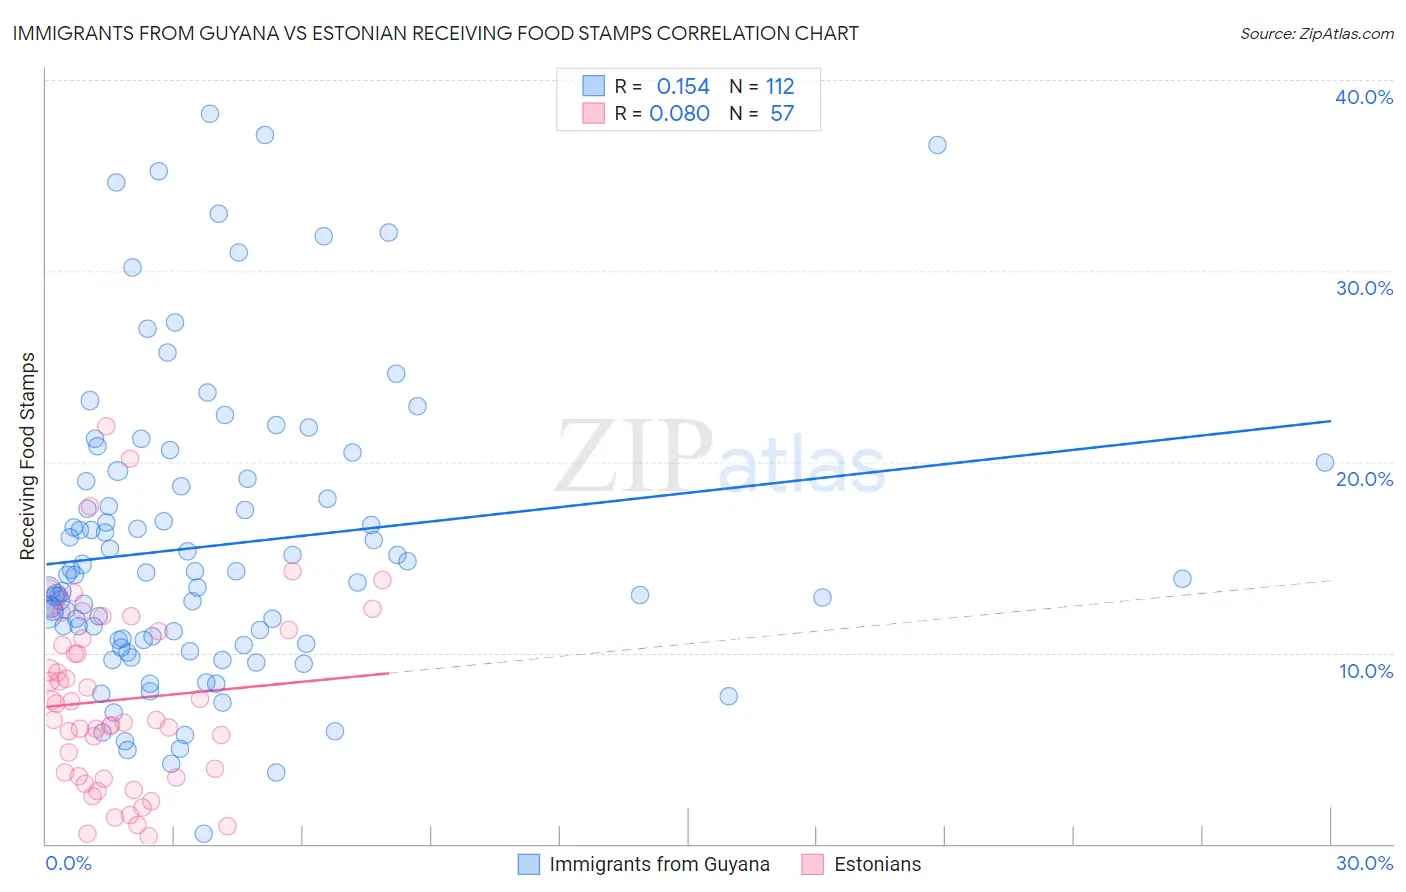
Immigrants from Guyana vs Estonian Receiving Food Stamps Correlation Chart
The statistical analysis conducted on geographies consisting of 183,583,231 people shows a poor positive correlation between the proportion of Immigrants from Guyana and percentage of population receiving government assistance and/or food stamps in the United States with a correlation coefficient (R) of 0.154 and weighted average of 16.9%. Similarly, the statistical analysis conducted on geographies consisting of 123,351,166 people shows a slight positive correlation between the proportion of Estonians and percentage of population receiving government assistance and/or food stamps in the United States with a correlation coefficient (R) of 0.080 and weighted average of 9.5%, a difference of 78.2%.
Receiving Food Stamps Correlation Summary
| Measurement | Immigrants from Guyana | Estonian |
| Minimum | 0.50% | 0.40% |
| Maximum | 38.2% | 21.8% |
| Range | 37.7% | 21.4% |
| Mean | 15.6% | 7.6% |
| Median | 14.0% | 6.5% |
| Interquartile 25% (IQ1) | 10.7% | 3.5% |
| Interquartile 75% (IQ3) | 19.1% | 10.9% |
| Interquartile Range (IQR) | 8.4% | 7.4% |
| Standard Deviation (Sample) | 7.8% | 4.8% |
| Standard Deviation (Population) | 7.7% | 4.8% |
Similar Demographics by Receiving Food Stamps
Demographics Similar to Immigrants from Guyana by Receiving Food Stamps
In terms of receiving food stamps, the demographic groups most similar to Immigrants from Guyana are Immigrants from Jamaica (16.9%, a difference of 0.17%), Sioux (16.8%, a difference of 0.45%), Bahamian (17.0%, a difference of 0.57%), Central American Indian (17.1%, a difference of 1.0%), and Guyanese (16.7%, a difference of 1.2%).
| Demographics | Rating | Rank | Receiving Food Stamps |
| Houma | 0.0 /100 | #307 | Tragic 16.5% |
| Barbadians | 0.0 /100 | #308 | Tragic 16.5% |
| U.S. Virgin Islanders | 0.0 /100 | #309 | Tragic 16.5% |
| Immigrants | Barbados | 0.0 /100 | #310 | Tragic 16.6% |
| Guyanese | 0.0 /100 | #311 | Tragic 16.7% |
| Sioux | 0.0 /100 | #312 | Tragic 16.8% |
| Immigrants | Jamaica | 0.0 /100 | #313 | Tragic 16.9% |
| Immigrants | Guyana | 0.0 /100 | #314 | Tragic 16.9% |
| Bahamians | 0.0 /100 | #315 | Tragic 17.0% |
| Central American Indians | 0.0 /100 | #316 | Tragic 17.1% |
| Blacks/African Americans | 0.0 /100 | #317 | Tragic 17.2% |
| Menominee | 0.0 /100 | #318 | Tragic 17.2% |
| Immigrants | St. Vincent and the Grenadines | 0.0 /100 | #319 | Tragic 17.2% |
| Immigrants | Nicaragua | 0.0 /100 | #320 | Tragic 17.2% |
| Natives/Alaskans | 0.0 /100 | #321 | Tragic 17.3% |
Demographics Similar to Estonians by Receiving Food Stamps
In terms of receiving food stamps, the demographic groups most similar to Estonians are Immigrants from Austria (9.5%, a difference of 0.020%), Turkish (9.5%, a difference of 0.050%), Zimbabwean (9.5%, a difference of 0.070%), European (9.5%, a difference of 0.070%), and Immigrants from Sri Lanka (9.5%, a difference of 0.36%).
| Demographics | Rating | Rank | Receiving Food Stamps |
| Immigrants | Lithuania | 99.8 /100 | #29 | Exceptional 9.2% |
| Immigrants | Sweden | 99.7 /100 | #30 | Exceptional 9.3% |
| Immigrants | Eastern Asia | 99.7 /100 | #31 | Exceptional 9.3% |
| Bolivians | 99.7 /100 | #32 | Exceptional 9.3% |
| Zimbabweans | 99.6 /100 | #33 | Exceptional 9.5% |
| Turks | 99.6 /100 | #34 | Exceptional 9.5% |
| Immigrants | Austria | 99.6 /100 | #35 | Exceptional 9.5% |
| Estonians | 99.6 /100 | #36 | Exceptional 9.5% |
| Europeans | 99.6 /100 | #37 | Exceptional 9.5% |
| Immigrants | Sri Lanka | 99.5 /100 | #38 | Exceptional 9.5% |
| Immigrants | Bolivia | 99.5 /100 | #39 | Exceptional 9.5% |
| Immigrants | Netherlands | 99.5 /100 | #40 | Exceptional 9.5% |
| Cambodians | 99.5 /100 | #41 | Exceptional 9.5% |
| Immigrants | China | 99.5 /100 | #42 | Exceptional 9.6% |
| Croatians | 99.5 /100 | #43 | Exceptional 9.6% |