Immigrants from Guatemala vs Native/Alaskan Child Poverty Among Girls Under 16
COMPARE
Immigrants from Guatemala
Native/Alaskan
Child Poverty Among Girls Under 16
Child Poverty Among Girls Under 16 Comparison
Immigrants from Guatemala
Natives/Alaskans
21.9%
CHILD POVERTY AMONG GIRLS UNDER 16
0.0/ 100
METRIC RATING
316th/ 347
METRIC RANK
24.0%
CHILD POVERTY AMONG GIRLS UNDER 16
0.0/ 100
METRIC RATING
332nd/ 347
METRIC RANK
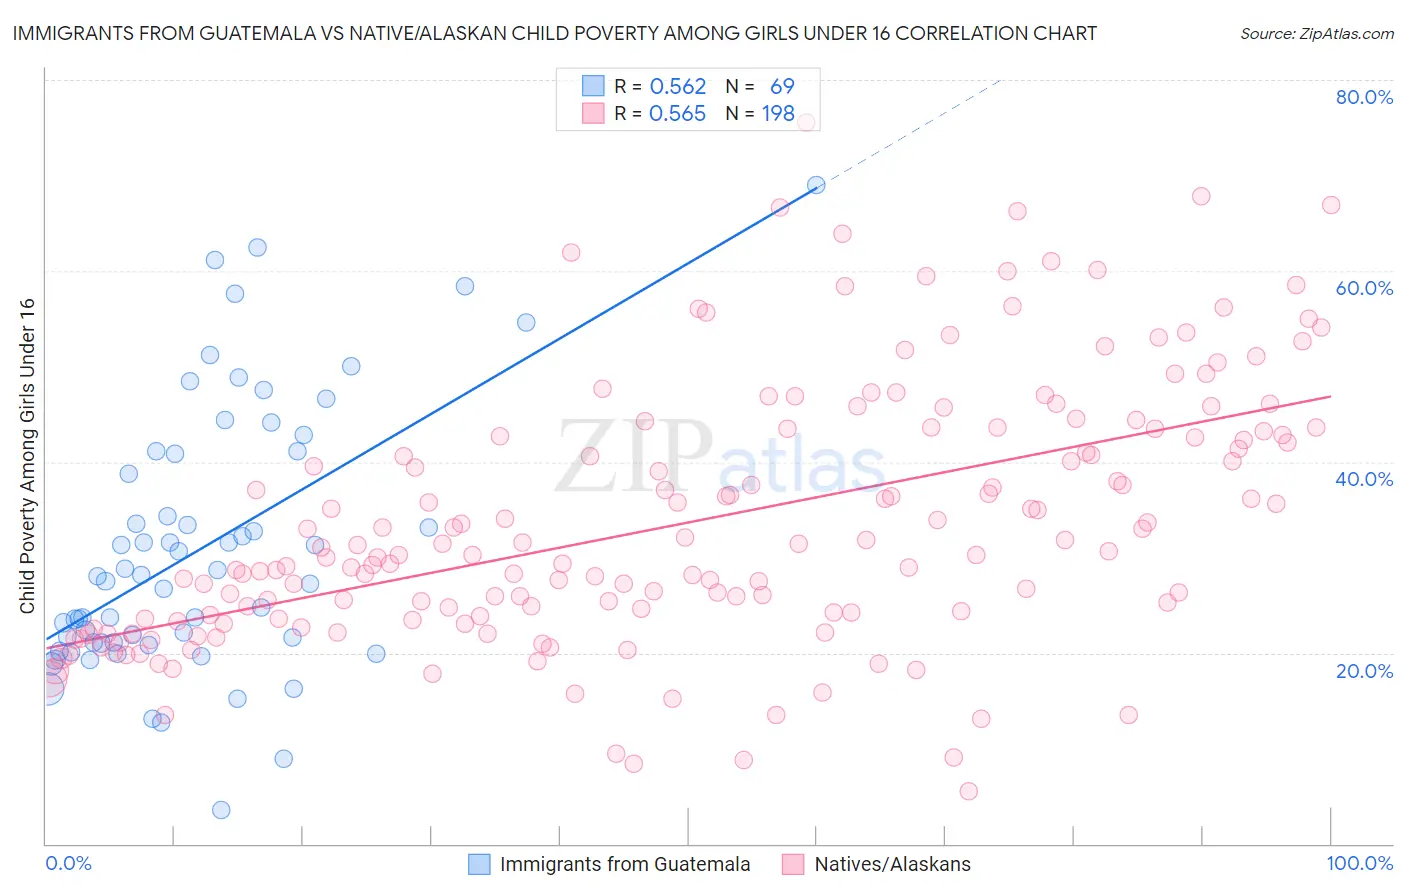
Immigrants from Guatemala vs Native/Alaskan Child Poverty Among Girls Under 16 Correlation Chart
The statistical analysis conducted on geographies consisting of 372,986,331 people shows a substantial positive correlation between the proportion of Immigrants from Guatemala and poverty level among girls under the age of 16 in the United States with a correlation coefficient (R) of 0.562 and weighted average of 21.9%. Similarly, the statistical analysis conducted on geographies consisting of 501,562,202 people shows a substantial positive correlation between the proportion of Natives/Alaskans and poverty level among girls under the age of 16 in the United States with a correlation coefficient (R) of 0.565 and weighted average of 24.0%, a difference of 10.0%.
Child Poverty Among Girls Under 16 Correlation Summary
| Measurement | Immigrants from Guatemala | Native/Alaskan |
| Minimum | 3.5% | 5.5% |
| Maximum | 69.0% | 75.5% |
| Range | 65.5% | 70.0% |
| Mean | 30.9% | 33.7% |
| Median | 28.1% | 30.5% |
| Interquartile 25% (IQ1) | 21.1% | 23.6% |
| Interquartile 75% (IQ3) | 40.9% | 42.8% |
| Interquartile Range (IQR) | 19.9% | 19.2% |
| Standard Deviation (Sample) | 13.8% | 13.6% |
| Standard Deviation (Population) | 13.7% | 13.5% |
Demographics Similar to Immigrants from Guatemala and Natives/Alaskans by Child Poverty Among Girls Under 16
In terms of child poverty among girls under 16, the demographic groups most similar to Immigrants from Guatemala are Ute (21.8%, a difference of 0.27%), African (21.9%, a difference of 0.32%), Arapaho (21.7%, a difference of 0.55%), Immigrants from Dominica (22.1%, a difference of 0.99%), and U.S. Virgin Islander (22.1%, a difference of 1.1%). Similarly, the demographic groups most similar to Natives/Alaskans are Apache (23.8%, a difference of 0.86%), Immigrants from Dominican Republic (23.8%, a difference of 0.91%), Kiowa (23.7%, a difference of 1.5%), Dominican (23.7%, a difference of 1.6%), and Black/African American (24.7%, a difference of 2.5%).
| Demographics | Rating | Rank | Child Poverty Among Girls Under 16 |
| Arapaho | 0.0 /100 | #314 | Tragic 21.7% |
| Ute | 0.0 /100 | #315 | Tragic 21.8% |
| Immigrants | Guatemala | 0.0 /100 | #316 | Tragic 21.9% |
| Africans | 0.0 /100 | #317 | Tragic 21.9% |
| Immigrants | Dominica | 0.0 /100 | #318 | Tragic 22.1% |
| U.S. Virgin Islanders | 0.0 /100 | #319 | Tragic 22.1% |
| Hondurans | 0.0 /100 | #320 | Tragic 22.2% |
| Colville | 0.0 /100 | #321 | Tragic 22.5% |
| Yakama | 0.0 /100 | #322 | Tragic 22.6% |
| Cajuns | 0.0 /100 | #323 | Tragic 22.6% |
| Paiute | 0.0 /100 | #324 | Tragic 22.6% |
| Immigrants | Congo | 0.0 /100 | #325 | Tragic 22.7% |
| Immigrants | Honduras | 0.0 /100 | #326 | Tragic 22.8% |
| Central American Indians | 0.0 /100 | #327 | Tragic 22.8% |
| Dominicans | 0.0 /100 | #328 | Tragic 23.7% |
| Kiowa | 0.0 /100 | #329 | Tragic 23.7% |
| Immigrants | Dominican Republic | 0.0 /100 | #330 | Tragic 23.8% |
| Apache | 0.0 /100 | #331 | Tragic 23.8% |
| Natives/Alaskans | 0.0 /100 | #332 | Tragic 24.0% |
| Blacks/African Americans | 0.0 /100 | #333 | Tragic 24.7% |
| Menominee | 0.0 /100 | #334 | Tragic 25.0% |