Immigrants from Czechoslovakia vs Native/Alaskan Child Poverty Among Girls Under 16
COMPARE
Immigrants from Czechoslovakia
Native/Alaskan
Child Poverty Among Girls Under 16
Child Poverty Among Girls Under 16 Comparison
Immigrants from Czechoslovakia
Natives/Alaskans
14.2%
CHILD POVERTY AMONG GIRLS UNDER 16
99.3/ 100
METRIC RATING
47th/ 347
METRIC RANK
24.0%
CHILD POVERTY AMONG GIRLS UNDER 16
0.0/ 100
METRIC RATING
332nd/ 347
METRIC RANK
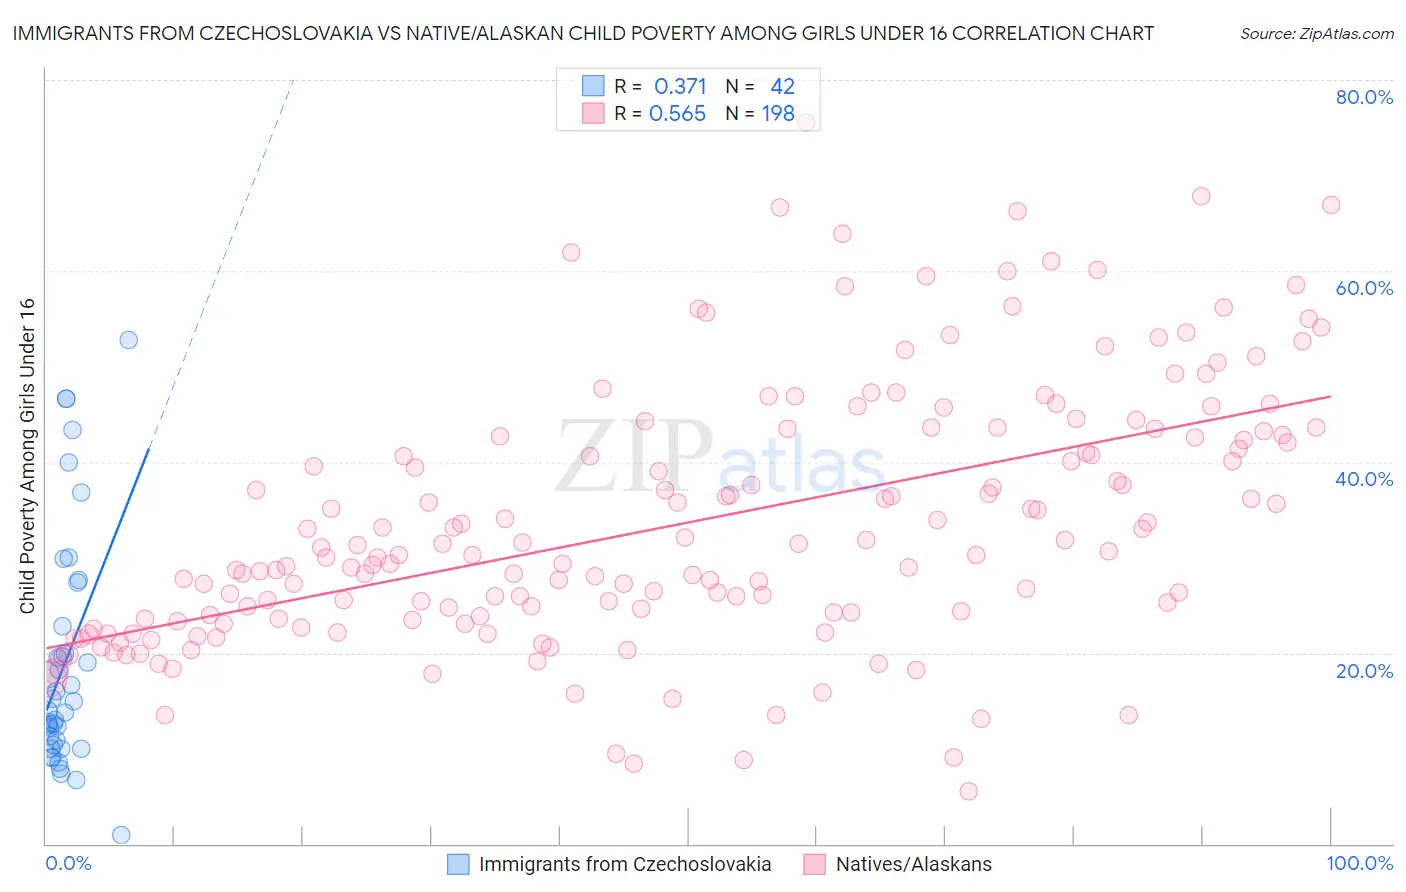
Immigrants from Czechoslovakia vs Native/Alaskan Child Poverty Among Girls Under 16 Correlation Chart
The statistical analysis conducted on geographies consisting of 192,771,534 people shows a mild positive correlation between the proportion of Immigrants from Czechoslovakia and poverty level among girls under the age of 16 in the United States with a correlation coefficient (R) of 0.371 and weighted average of 14.2%. Similarly, the statistical analysis conducted on geographies consisting of 501,562,202 people shows a substantial positive correlation between the proportion of Natives/Alaskans and poverty level among girls under the age of 16 in the United States with a correlation coefficient (R) of 0.565 and weighted average of 24.0%, a difference of 69.9%.
Child Poverty Among Girls Under 16 Correlation Summary
| Measurement | Immigrants from Czechoslovakia | Native/Alaskan |
| Minimum | 0.88% | 5.5% |
| Maximum | 52.8% | 75.5% |
| Range | 51.9% | 70.0% |
| Mean | 18.9% | 33.7% |
| Median | 14.4% | 30.5% |
| Interquartile 25% (IQ1) | 10.3% | 23.6% |
| Interquartile 75% (IQ3) | 22.7% | 42.8% |
| Interquartile Range (IQR) | 12.4% | 19.2% |
| Standard Deviation (Sample) | 12.4% | 13.6% |
| Standard Deviation (Population) | 12.2% | 13.5% |
Similar Demographics by Child Poverty Among Girls Under 16
Demographics Similar to Immigrants from Czechoslovakia by Child Poverty Among Girls Under 16
In terms of child poverty among girls under 16, the demographic groups most similar to Immigrants from Czechoslovakia are Czech (14.2%, a difference of 0.020%), Croatian (14.1%, a difference of 0.030%), Immigrants from Greece (14.1%, a difference of 0.060%), Greek (14.2%, a difference of 0.060%), and Immigrants from Israel (14.2%, a difference of 0.12%).
| Demographics | Rating | Rank | Child Poverty Among Girls Under 16 |
| Immigrants | Sri Lanka | 99.5 /100 | #40 | Exceptional 14.0% |
| Immigrants | Bolivia | 99.5 /100 | #41 | Exceptional 14.0% |
| Immigrants | Scotland | 99.4 /100 | #42 | Exceptional 14.0% |
| Koreans | 99.4 /100 | #43 | Exceptional 14.1% |
| Immigrants | Asia | 99.4 /100 | #44 | Exceptional 14.1% |
| Immigrants | Greece | 99.3 /100 | #45 | Exceptional 14.1% |
| Croatians | 99.3 /100 | #46 | Exceptional 14.1% |
| Immigrants | Czechoslovakia | 99.3 /100 | #47 | Exceptional 14.2% |
| Czechs | 99.3 /100 | #48 | Exceptional 14.2% |
| Greeks | 99.2 /100 | #49 | Exceptional 14.2% |
| Immigrants | Israel | 99.2 /100 | #50 | Exceptional 14.2% |
| Immigrants | Pakistan | 99.1 /100 | #51 | Exceptional 14.2% |
| Italians | 99.1 /100 | #52 | Exceptional 14.3% |
| Luxembourgers | 99.0 /100 | #53 | Exceptional 14.3% |
| Estonians | 98.9 /100 | #54 | Exceptional 14.3% |
Demographics Similar to Natives/Alaskans by Child Poverty Among Girls Under 16
In terms of child poverty among girls under 16, the demographic groups most similar to Natives/Alaskans are Apache (23.8%, a difference of 0.86%), Immigrants from Dominican Republic (23.8%, a difference of 0.91%), Kiowa (23.7%, a difference of 1.5%), Dominican (23.7%, a difference of 1.6%), and Black/African American (24.7%, a difference of 2.5%).
| Demographics | Rating | Rank | Child Poverty Among Girls Under 16 |
| Immigrants | Congo | 0.0 /100 | #325 | Tragic 22.7% |
| Immigrants | Honduras | 0.0 /100 | #326 | Tragic 22.8% |
| Central American Indians | 0.0 /100 | #327 | Tragic 22.8% |
| Dominicans | 0.0 /100 | #328 | Tragic 23.7% |
| Kiowa | 0.0 /100 | #329 | Tragic 23.7% |
| Immigrants | Dominican Republic | 0.0 /100 | #330 | Tragic 23.8% |
| Apache | 0.0 /100 | #331 | Tragic 23.8% |
| Natives/Alaskans | 0.0 /100 | #332 | Tragic 24.0% |
| Blacks/African Americans | 0.0 /100 | #333 | Tragic 24.7% |
| Menominee | 0.0 /100 | #334 | Tragic 25.0% |
| Pueblo | 0.0 /100 | #335 | Tragic 25.2% |
| Sioux | 0.0 /100 | #336 | Tragic 25.6% |
| Yup'ik | 0.0 /100 | #337 | Tragic 25.8% |
| Cheyenne | 0.0 /100 | #338 | Tragic 26.3% |
| Crow | 0.0 /100 | #339 | Tragic 26.4% |