Immigrants from Guatemala vs Native/Alaskan 1st Grade
COMPARE
Immigrants from Guatemala
Native/Alaskan
1st Grade
1st Grade Comparison
Immigrants from Guatemala
Natives/Alaskans
96.4%
1ST GRADE
0.0/ 100
METRIC RATING
339th/ 347
METRIC RANK
97.9%
1ST GRADE
50.0/ 100
METRIC RATING
174th/ 347
METRIC RANK
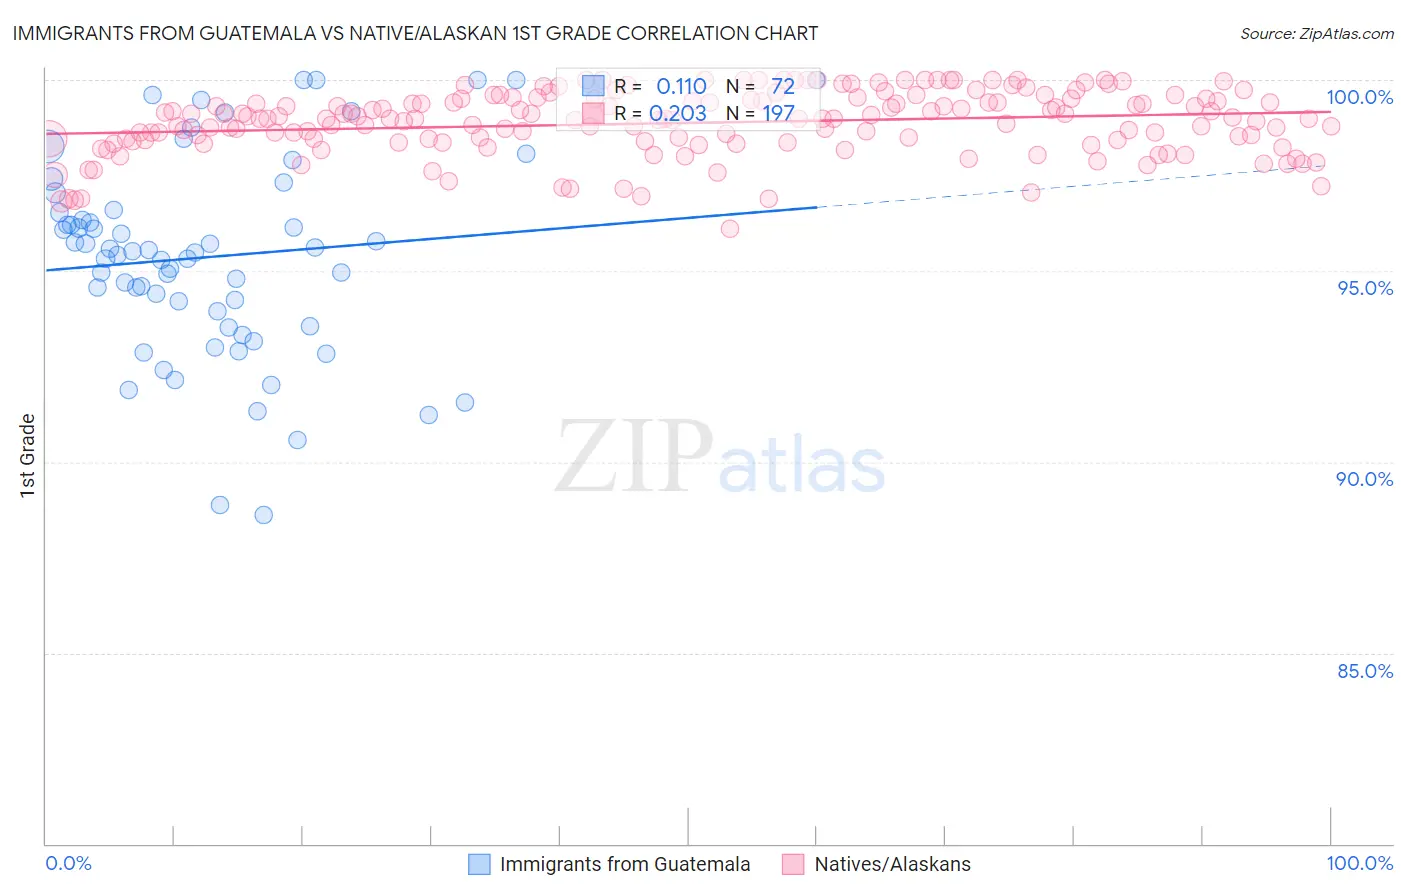
Immigrants from Guatemala vs Native/Alaskan 1st Grade Correlation Chart
The statistical analysis conducted on geographies consisting of 377,282,938 people shows a poor positive correlation between the proportion of Immigrants from Guatemala and percentage of population with at least 1st grade education in the United States with a correlation coefficient (R) of 0.110 and weighted average of 96.4%. Similarly, the statistical analysis conducted on geographies consisting of 513,051,799 people shows a weak positive correlation between the proportion of Natives/Alaskans and percentage of population with at least 1st grade education in the United States with a correlation coefficient (R) of 0.203 and weighted average of 97.9%, a difference of 1.6%.
1st Grade Correlation Summary
| Measurement | Immigrants from Guatemala | Native/Alaskan |
| Minimum | 88.6% | 96.1% |
| Maximum | 100.0% | 100.0% |
| Range | 11.4% | 3.9% |
| Mean | 95.4% | 98.9% |
| Median | 95.5% | 99.0% |
| Interquartile 25% (IQ1) | 93.8% | 98.4% |
| Interquartile 75% (IQ3) | 96.6% | 99.5% |
| Interquartile Range (IQR) | 2.8% | 1.1% |
| Standard Deviation (Sample) | 2.6% | 0.82% |
| Standard Deviation (Population) | 2.6% | 0.82% |
Similar Demographics by 1st Grade
Demographics Similar to Immigrants from Guatemala by 1st Grade
In terms of 1st grade, the demographic groups most similar to Immigrants from Guatemala are Immigrants from Cabo Verde (96.3%, a difference of 0.020%), Immigrants from Central America (96.3%, a difference of 0.040%), Immigrants from Fiji (96.4%, a difference of 0.070%), Immigrants from Mexico (96.3%, a difference of 0.070%), and Immigrants from Cambodia (96.5%, a difference of 0.090%).
| Demographics | Rating | Rank | 1st Grade |
| Central Americans | 0.0 /100 | #332 | Tragic 96.5% |
| Immigrants | Dominican Republic | 0.0 /100 | #333 | Tragic 96.5% |
| Bangladeshis | 0.0 /100 | #334 | Tragic 96.5% |
| Yakama | 0.0 /100 | #335 | Tragic 96.5% |
| Guatemalans | 0.0 /100 | #336 | Tragic 96.5% |
| Immigrants | Cambodia | 0.0 /100 | #337 | Tragic 96.5% |
| Immigrants | Fiji | 0.0 /100 | #338 | Tragic 96.4% |
| Immigrants | Guatemala | 0.0 /100 | #339 | Tragic 96.4% |
| Immigrants | Cabo Verde | 0.0 /100 | #340 | Tragic 96.3% |
| Immigrants | Central America | 0.0 /100 | #341 | Tragic 96.3% |
| Immigrants | Mexico | 0.0 /100 | #342 | Tragic 96.3% |
| Salvadorans | 0.0 /100 | #343 | Tragic 96.3% |
| Nepalese | 0.0 /100 | #344 | Tragic 96.1% |
| Immigrants | El Salvador | 0.0 /100 | #345 | Tragic 96.1% |
| Immigrants | Yemen | 0.0 /100 | #346 | Tragic 95.8% |
Demographics Similar to Natives/Alaskans by 1st Grade
In terms of 1st grade, the demographic groups most similar to Natives/Alaskans are Kenyan (97.9%, a difference of 0.0%), Immigrants from Sri Lanka (97.9%, a difference of 0.0%), Albanian (97.9%, a difference of 0.0%), Immigrants from Brazil (97.9%, a difference of 0.0%), and Immigrants from Jordan (97.9%, a difference of 0.010%).
| Demographics | Rating | Rank | 1st Grade |
| Bermudans | 56.3 /100 | #167 | Average 97.9% |
| Chileans | 55.6 /100 | #168 | Average 97.9% |
| Immigrants | Micronesia | 55.3 /100 | #169 | Average 97.9% |
| Immigrants | Spain | 54.9 /100 | #170 | Average 97.9% |
| Immigrants | Jordan | 53.9 /100 | #171 | Average 97.9% |
| Immigrants | Korea | 53.0 /100 | #172 | Average 97.9% |
| Kenyans | 51.2 /100 | #173 | Average 97.9% |
| Natives/Alaskans | 50.0 /100 | #174 | Average 97.9% |
| Immigrants | Sri Lanka | 49.7 /100 | #175 | Average 97.9% |
| Albanians | 49.6 /100 | #176 | Average 97.9% |
| Immigrants | Brazil | 49.1 /100 | #177 | Average 97.9% |
| Immigrants | Venezuela | 47.8 /100 | #178 | Average 97.9% |
| Argentineans | 47.2 /100 | #179 | Average 97.9% |
| Immigrants | Bosnia and Herzegovina | 46.6 /100 | #180 | Average 97.9% |
| Portuguese | 44.2 /100 | #181 | Average 97.9% |