Immigrants from Guatemala vs Native/Alaskan Vision Disability
COMPARE
Immigrants from Guatemala
Native/Alaskan
Vision Disability
Vision Disability Comparison
Immigrants from Guatemala
Natives/Alaskans
2.4%
VISION DISABILITY
0.3/ 100
METRIC RATING
255th/ 347
METRIC RANK
3.0%
VISION DISABILITY
0.0/ 100
METRIC RATING
327th/ 347
METRIC RANK
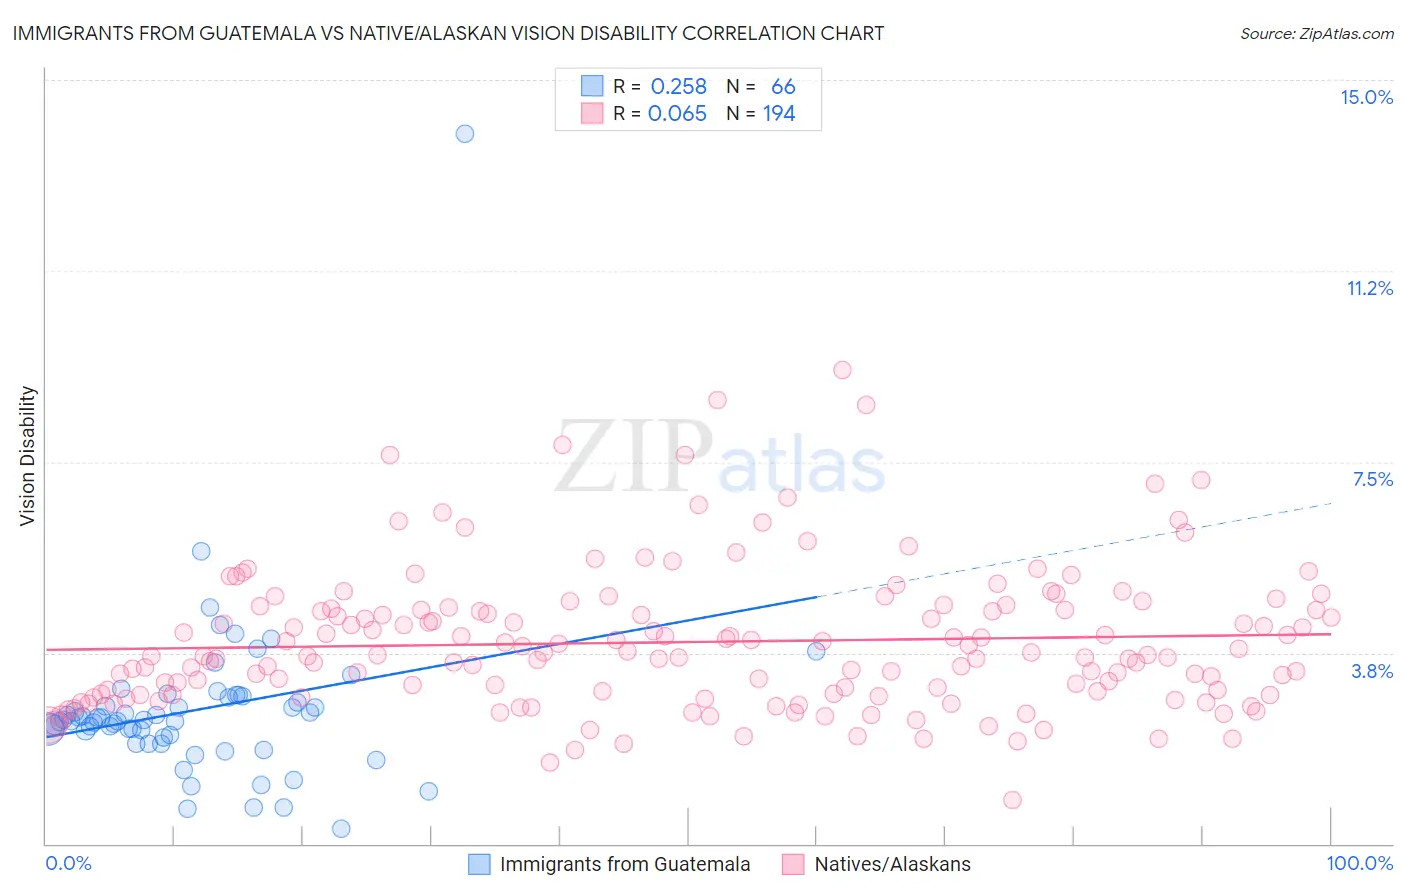
Immigrants from Guatemala vs Native/Alaskan Vision Disability Correlation Chart
The statistical analysis conducted on geographies consisting of 377,092,792 people shows a weak positive correlation between the proportion of Immigrants from Guatemala and percentage of population with vision disability in the United States with a correlation coefficient (R) of 0.258 and weighted average of 2.4%. Similarly, the statistical analysis conducted on geographies consisting of 512,205,418 people shows a slight positive correlation between the proportion of Natives/Alaskans and percentage of population with vision disability in the United States with a correlation coefficient (R) of 0.065 and weighted average of 3.0%, a difference of 25.3%.
Vision Disability Correlation Summary
| Measurement | Immigrants from Guatemala | Native/Alaskan |
| Minimum | 0.29% | 0.86% |
| Maximum | 14.0% | 9.3% |
| Range | 13.7% | 8.5% |
| Mean | 2.6% | 4.0% |
| Median | 2.4% | 3.7% |
| Interquartile 25% (IQ1) | 2.1% | 2.9% |
| Interquartile 75% (IQ3) | 2.9% | 4.6% |
| Interquartile Range (IQR) | 0.78% | 1.7% |
| Standard Deviation (Sample) | 1.7% | 1.4% |
| Standard Deviation (Population) | 1.7% | 1.4% |
Similar Demographics by Vision Disability
Demographics Similar to Immigrants from Guatemala by Vision Disability
In terms of vision disability, the demographic groups most similar to Immigrants from Guatemala are Haitian (2.4%, a difference of 0.030%), Japanese (2.4%, a difference of 0.31%), Immigrants from Haiti (2.4%, a difference of 0.33%), Immigrants from Micronesia (2.4%, a difference of 0.38%), and West Indian (2.4%, a difference of 0.40%).
| Demographics | Rating | Rank | Vision Disability |
| Sub-Saharan Africans | 0.5 /100 | #248 | Tragic 2.3% |
| Liberians | 0.5 /100 | #249 | Tragic 2.3% |
| Bangladeshis | 0.5 /100 | #250 | Tragic 2.3% |
| Immigrants | Laos | 0.4 /100 | #251 | Tragic 2.4% |
| Immigrants | Micronesia | 0.3 /100 | #252 | Tragic 2.4% |
| Japanese | 0.3 /100 | #253 | Tragic 2.4% |
| Haitians | 0.3 /100 | #254 | Tragic 2.4% |
| Immigrants | Guatemala | 0.3 /100 | #255 | Tragic 2.4% |
| Immigrants | Haiti | 0.2 /100 | #256 | Tragic 2.4% |
| West Indians | 0.2 /100 | #257 | Tragic 2.4% |
| British West Indians | 0.2 /100 | #258 | Tragic 2.4% |
| Whites/Caucasians | 0.2 /100 | #259 | Tragic 2.4% |
| Belizeans | 0.2 /100 | #260 | Tragic 2.4% |
| Fijians | 0.1 /100 | #261 | Tragic 2.4% |
| Jamaicans | 0.1 /100 | #262 | Tragic 2.4% |
Demographics Similar to Natives/Alaskans by Vision Disability
In terms of vision disability, the demographic groups most similar to Natives/Alaskans are Yuman (3.0%, a difference of 0.54%), Apache (3.0%, a difference of 0.74%), Spanish American (2.9%, a difference of 0.80%), Colville (3.0%, a difference of 1.9%), and Cherokee (2.9%, a difference of 2.0%).
| Demographics | Rating | Rank | Vision Disability |
| Blacks/African Americans | 0.0 /100 | #320 | Tragic 2.8% |
| Comanche | 0.0 /100 | #321 | Tragic 2.8% |
| Paiute | 0.0 /100 | #322 | Tragic 2.9% |
| Tlingit-Haida | 0.0 /100 | #323 | Tragic 2.9% |
| Hopi | 0.0 /100 | #324 | Tragic 2.9% |
| Cherokee | 0.0 /100 | #325 | Tragic 2.9% |
| Spanish Americans | 0.0 /100 | #326 | Tragic 2.9% |
| Natives/Alaskans | 0.0 /100 | #327 | Tragic 3.0% |
| Yuman | 0.0 /100 | #328 | Tragic 3.0% |
| Apache | 0.0 /100 | #329 | Tragic 3.0% |
| Colville | 0.0 /100 | #330 | Tragic 3.0% |
| Central American Indians | 0.0 /100 | #331 | Tragic 3.0% |
| Seminole | 0.0 /100 | #332 | Tragic 3.1% |
| Cajuns | 0.0 /100 | #333 | Tragic 3.1% |
| Cheyenne | 0.0 /100 | #334 | Tragic 3.1% |