Immigrants from Guatemala vs Immigrants from Uganda Disability Age 35 to 64
COMPARE
Immigrants from Guatemala
Immigrants from Uganda
Disability Age 35 to 64
Disability Age 35 to 64 Comparison
Immigrants from Guatemala
Immigrants from Uganda
11.6%
DISABILITY AGE 35 TO 64
17.5/ 100
METRIC RATING
202nd/ 347
METRIC RANK
11.2%
DISABILITY AGE 35 TO 64
58.0/ 100
METRIC RATING
170th/ 347
METRIC RANK
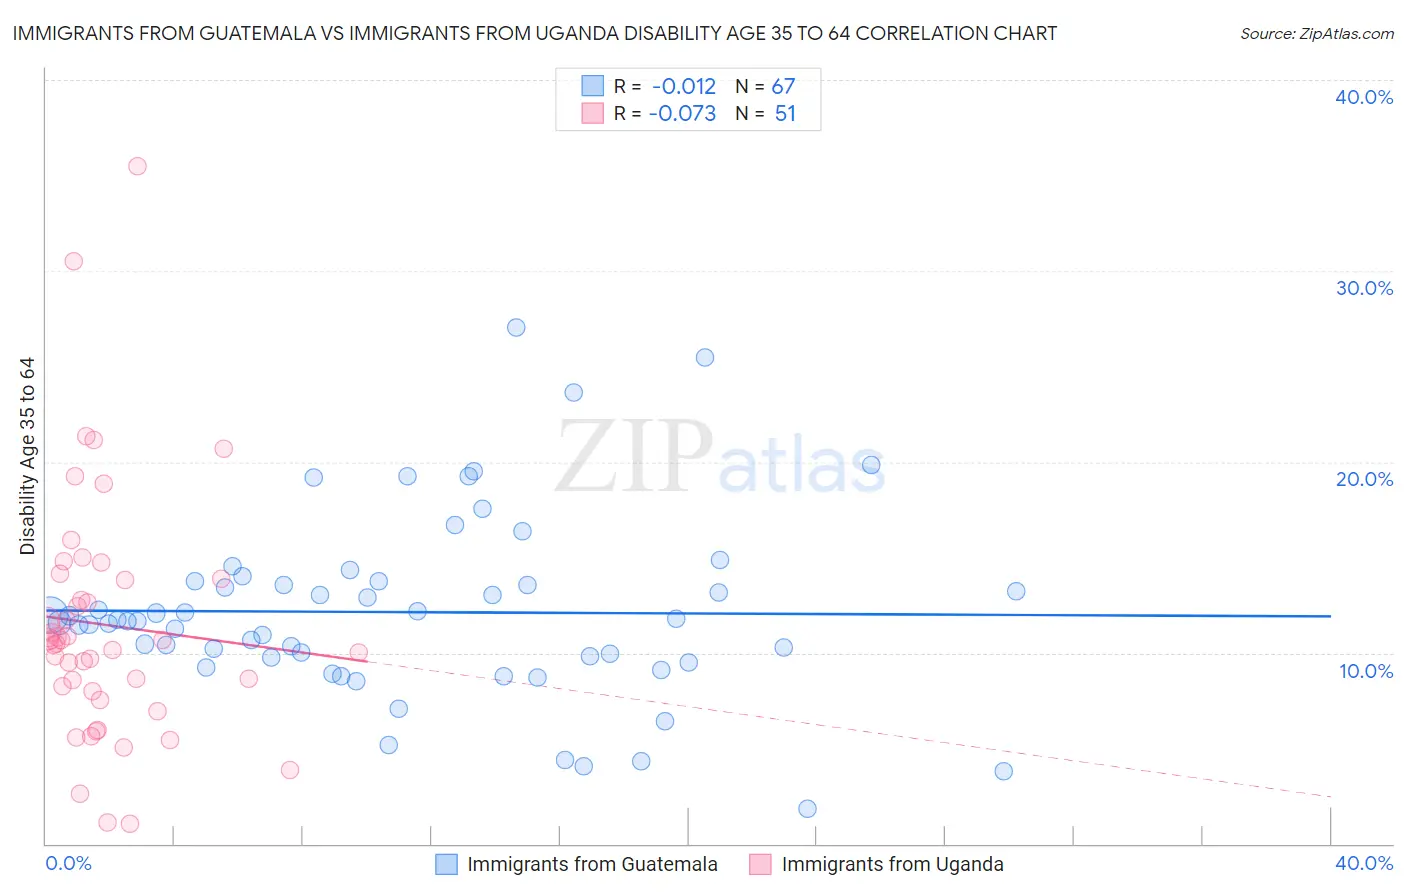
Immigrants from Guatemala vs Immigrants from Uganda Disability Age 35 to 64 Correlation Chart
The statistical analysis conducted on geographies consisting of 377,121,511 people shows no correlation between the proportion of Immigrants from Guatemala and percentage of population with a disability between the ages 34 and 64 in the United States with a correlation coefficient (R) of -0.012 and weighted average of 11.6%. Similarly, the statistical analysis conducted on geographies consisting of 125,969,840 people shows a slight negative correlation between the proportion of Immigrants from Uganda and percentage of population with a disability between the ages 34 and 64 in the United States with a correlation coefficient (R) of -0.073 and weighted average of 11.2%, a difference of 3.8%.
Disability Age 35 to 64 Correlation Summary
| Measurement | Immigrants from Guatemala | Immigrants from Uganda |
| Minimum | 1.8% | 1.1% |
| Maximum | 27.0% | 35.5% |
| Range | 25.2% | 34.4% |
| Mean | 12.1% | 11.5% |
| Median | 11.6% | 10.6% |
| Interquartile 25% (IQ1) | 9.8% | 8.0% |
| Interquartile 75% (IQ3) | 13.8% | 13.9% |
| Interquartile Range (IQR) | 4.0% | 5.9% |
| Standard Deviation (Sample) | 4.8% | 6.4% |
| Standard Deviation (Population) | 4.7% | 6.4% |
Similar Demographics by Disability Age 35 to 64
Demographics Similar to Immigrants from Guatemala by Disability Age 35 to 64
In terms of disability age 35 to 64, the demographic groups most similar to Immigrants from Guatemala are Immigrants from Kenya (11.6%, a difference of 0.020%), British (11.6%, a difference of 0.060%), Swiss (11.6%, a difference of 0.15%), Nigerian (11.6%, a difference of 0.17%), and Basque (11.6%, a difference of 0.25%).
| Demographics | Rating | Rank | Disability Age 35 to 64 |
| Carpatho Rusyns | 25.3 /100 | #195 | Fair 11.5% |
| Iraqis | 24.2 /100 | #196 | Fair 11.5% |
| Immigrants | Iraq | 21.0 /100 | #197 | Fair 11.6% |
| Immigrants | Panama | 20.4 /100 | #198 | Fair 11.6% |
| Basques | 19.5 /100 | #199 | Poor 11.6% |
| Swiss | 18.7 /100 | #200 | Poor 11.6% |
| Immigrants | Kenya | 17.7 /100 | #201 | Poor 11.6% |
| Immigrants | Guatemala | 17.5 /100 | #202 | Poor 11.6% |
| British | 17.0 /100 | #203 | Poor 11.6% |
| Nigerians | 16.3 /100 | #204 | Poor 11.6% |
| Slavs | 15.5 /100 | #205 | Poor 11.7% |
| Native Hawaiians | 14.8 /100 | #206 | Poor 11.7% |
| Ghanaians | 14.8 /100 | #207 | Poor 11.7% |
| Guatemalans | 14.6 /100 | #208 | Poor 11.7% |
| Europeans | 13.5 /100 | #209 | Poor 11.7% |
Demographics Similar to Immigrants from Uganda by Disability Age 35 to 64
In terms of disability age 35 to 64, the demographic groups most similar to Immigrants from Uganda are Haitian (11.2%, a difference of 0.080%), Central American (11.2%, a difference of 0.090%), Immigrants from Trinidad and Tobago (11.2%, a difference of 0.17%), Italian (11.2%, a difference of 0.19%), and Austrian (11.1%, a difference of 0.45%).
| Demographics | Rating | Rank | Disability Age 35 to 64 |
| Immigrants | St. Vincent and the Grenadines | 66.6 /100 | #163 | Good 11.1% |
| Pakistanis | 65.8 /100 | #164 | Good 11.1% |
| Immigrants | Western Europe | 65.2 /100 | #165 | Good 11.1% |
| Immigrants | Haiti | 63.8 /100 | #166 | Good 11.1% |
| Austrians | 63.2 /100 | #167 | Good 11.1% |
| Central Americans | 59.1 /100 | #168 | Average 11.2% |
| Haitians | 59.0 /100 | #169 | Average 11.2% |
| Immigrants | Uganda | 58.0 /100 | #170 | Average 11.2% |
| Immigrants | Trinidad and Tobago | 55.9 /100 | #171 | Average 11.2% |
| Italians | 55.6 /100 | #172 | Average 11.2% |
| Lebanese | 51.8 /100 | #173 | Average 11.3% |
| Immigrants | Fiji | 50.0 /100 | #174 | Average 11.3% |
| Czechs | 47.9 /100 | #175 | Average 11.3% |
| Ugandans | 43.7 /100 | #176 | Average 11.3% |
| Immigrants | Eastern Africa | 42.2 /100 | #177 | Average 11.3% |