Immigrants from Bolivia vs Hmong Female Poverty
COMPARE
Immigrants from Bolivia
Hmong
Female Poverty
Female Poverty Comparison
Immigrants from Bolivia
Hmong
11.5%
FEMALE POVERTY
99.8/ 100
METRIC RATING
16th/ 347
METRIC RANK
13.9%
FEMALE POVERTY
21.1/ 100
METRIC RATING
202nd/ 347
METRIC RANK
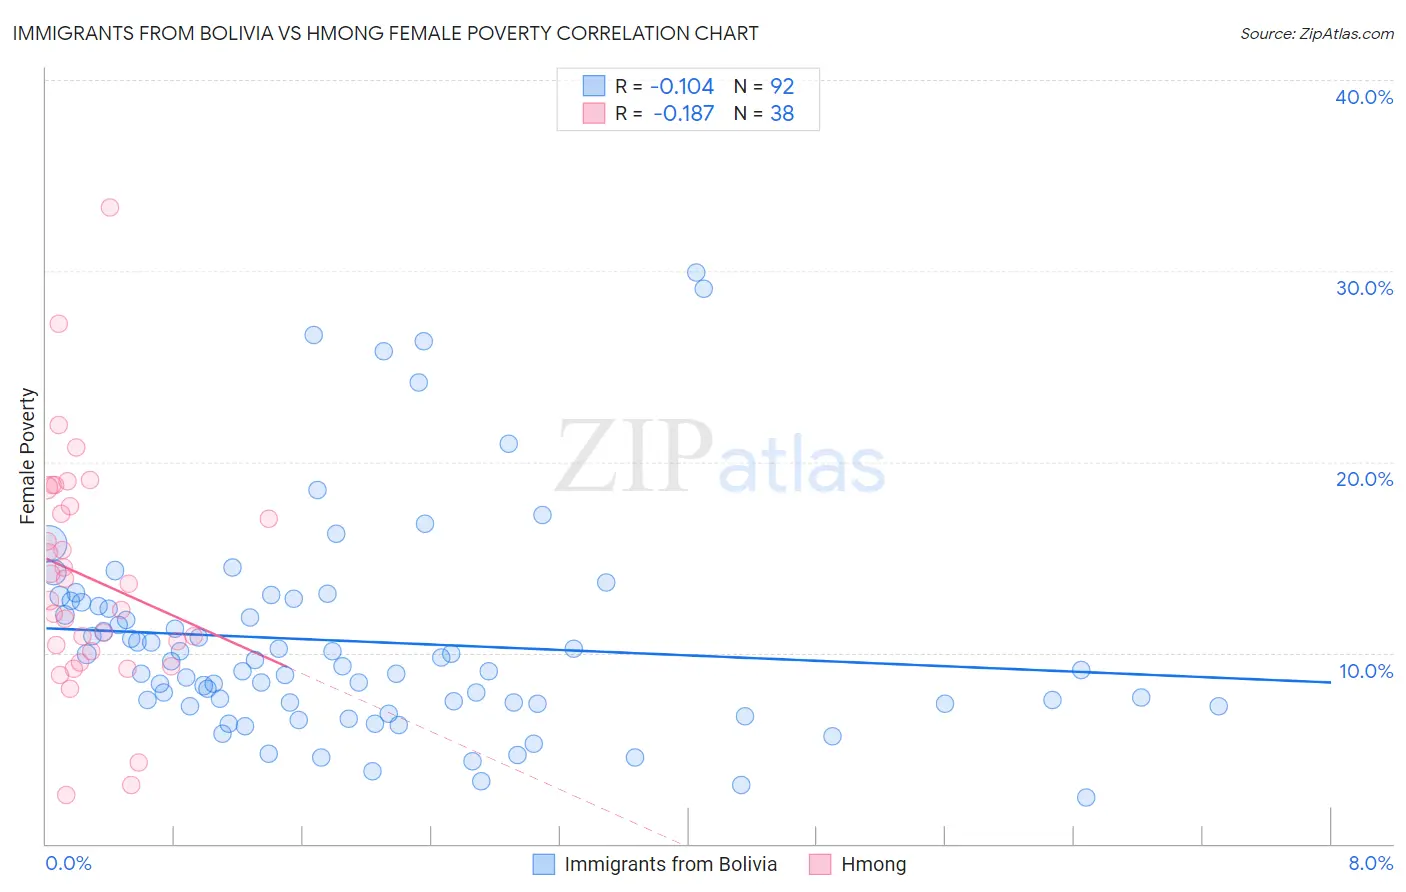
Immigrants from Bolivia vs Hmong Female Poverty Correlation Chart
The statistical analysis conducted on geographies consisting of 158,699,026 people shows a poor negative correlation between the proportion of Immigrants from Bolivia and poverty level among females in the United States with a correlation coefficient (R) of -0.104 and weighted average of 11.5%. Similarly, the statistical analysis conducted on geographies consisting of 24,669,739 people shows a poor negative correlation between the proportion of Hmong and poverty level among females in the United States with a correlation coefficient (R) of -0.187 and weighted average of 13.9%, a difference of 20.8%.
Female Poverty Correlation Summary
| Measurement | Immigrants from Bolivia | Hmong |
| Minimum | 2.4% | 2.5% |
| Maximum | 29.9% | 33.3% |
| Range | 27.5% | 30.8% |
| Mean | 10.6% | 13.9% |
| Median | 9.2% | 13.2% |
| Interquartile 25% (IQ1) | 7.3% | 10.1% |
| Interquartile 75% (IQ3) | 12.5% | 17.7% |
| Interquartile Range (IQR) | 5.2% | 7.6% |
| Standard Deviation (Sample) | 5.6% | 6.1% |
| Standard Deviation (Population) | 5.6% | 6.1% |
Similar Demographics by Female Poverty
Demographics Similar to Immigrants from Bolivia by Female Poverty
In terms of female poverty, the demographic groups most similar to Immigrants from Bolivia are Bolivian (11.5%, a difference of 0.070%), Immigrants from Scotland (11.5%, a difference of 0.12%), Norwegian (11.5%, a difference of 0.16%), Eastern European (11.5%, a difference of 0.39%), and Latvian (11.4%, a difference of 0.47%).
| Demographics | Rating | Rank | Female Poverty |
| Bulgarians | 99.9 /100 | #9 | Exceptional 11.1% |
| Immigrants | Hong Kong | 99.9 /100 | #10 | Exceptional 11.2% |
| Maltese | 99.9 /100 | #11 | Exceptional 11.2% |
| Bhutanese | 99.9 /100 | #12 | Exceptional 11.3% |
| Immigrants | Lithuania | 99.9 /100 | #13 | Exceptional 11.3% |
| Lithuanians | 99.8 /100 | #14 | Exceptional 11.4% |
| Latvians | 99.8 /100 | #15 | Exceptional 11.4% |
| Immigrants | Bolivia | 99.8 /100 | #16 | Exceptional 11.5% |
| Bolivians | 99.8 /100 | #17 | Exceptional 11.5% |
| Immigrants | Scotland | 99.8 /100 | #18 | Exceptional 11.5% |
| Norwegians | 99.8 /100 | #19 | Exceptional 11.5% |
| Eastern Europeans | 99.7 /100 | #20 | Exceptional 11.5% |
| Italians | 99.7 /100 | #21 | Exceptional 11.6% |
| Swedes | 99.7 /100 | #22 | Exceptional 11.6% |
| Burmese | 99.7 /100 | #23 | Exceptional 11.6% |
Demographics Similar to Hmong by Female Poverty
In terms of female poverty, the demographic groups most similar to Hmong are Immigrants from Kenya (13.9%, a difference of 0.010%), Spanish (13.9%, a difference of 0.050%), Immigrants from Western Asia (13.9%, a difference of 0.050%), Spaniard (13.9%, a difference of 0.32%), and Immigrants from Lebanon (13.8%, a difference of 0.60%).
| Demographics | Rating | Rank | Female Poverty |
| Immigrants | South America | 30.6 /100 | #195 | Fair 13.7% |
| South American Indians | 28.9 /100 | #196 | Fair 13.7% |
| Arabs | 28.6 /100 | #197 | Fair 13.7% |
| Immigrants | Uganda | 28.5 /100 | #198 | Fair 13.7% |
| Immigrants | Lebanon | 25.6 /100 | #199 | Fair 13.8% |
| Spanish | 21.4 /100 | #200 | Fair 13.9% |
| Immigrants | Kenya | 21.1 /100 | #201 | Fair 13.9% |
| Hmong | 21.1 /100 | #202 | Fair 13.9% |
| Immigrants | Western Asia | 20.7 /100 | #203 | Fair 13.9% |
| Spaniards | 18.9 /100 | #204 | Poor 13.9% |
| Ugandans | 15.4 /100 | #205 | Poor 14.0% |
| Immigrants | Uruguay | 14.0 /100 | #206 | Poor 14.0% |
| Immigrants | Eastern Africa | 9.0 /100 | #207 | Tragic 14.2% |
| Immigrants | Azores | 7.9 /100 | #208 | Tragic 14.2% |
| Panamanians | 7.7 /100 | #209 | Tragic 14.2% |