Uruguayan vs Hmong Female Poverty
COMPARE
Uruguayan
Hmong
Female Poverty
Female Poverty Comparison
Uruguayans
Hmong
13.6%
FEMALE POVERTY
39.8/ 100
METRIC RATING
189th/ 347
METRIC RANK
13.9%
FEMALE POVERTY
21.1/ 100
METRIC RATING
202nd/ 347
METRIC RANK
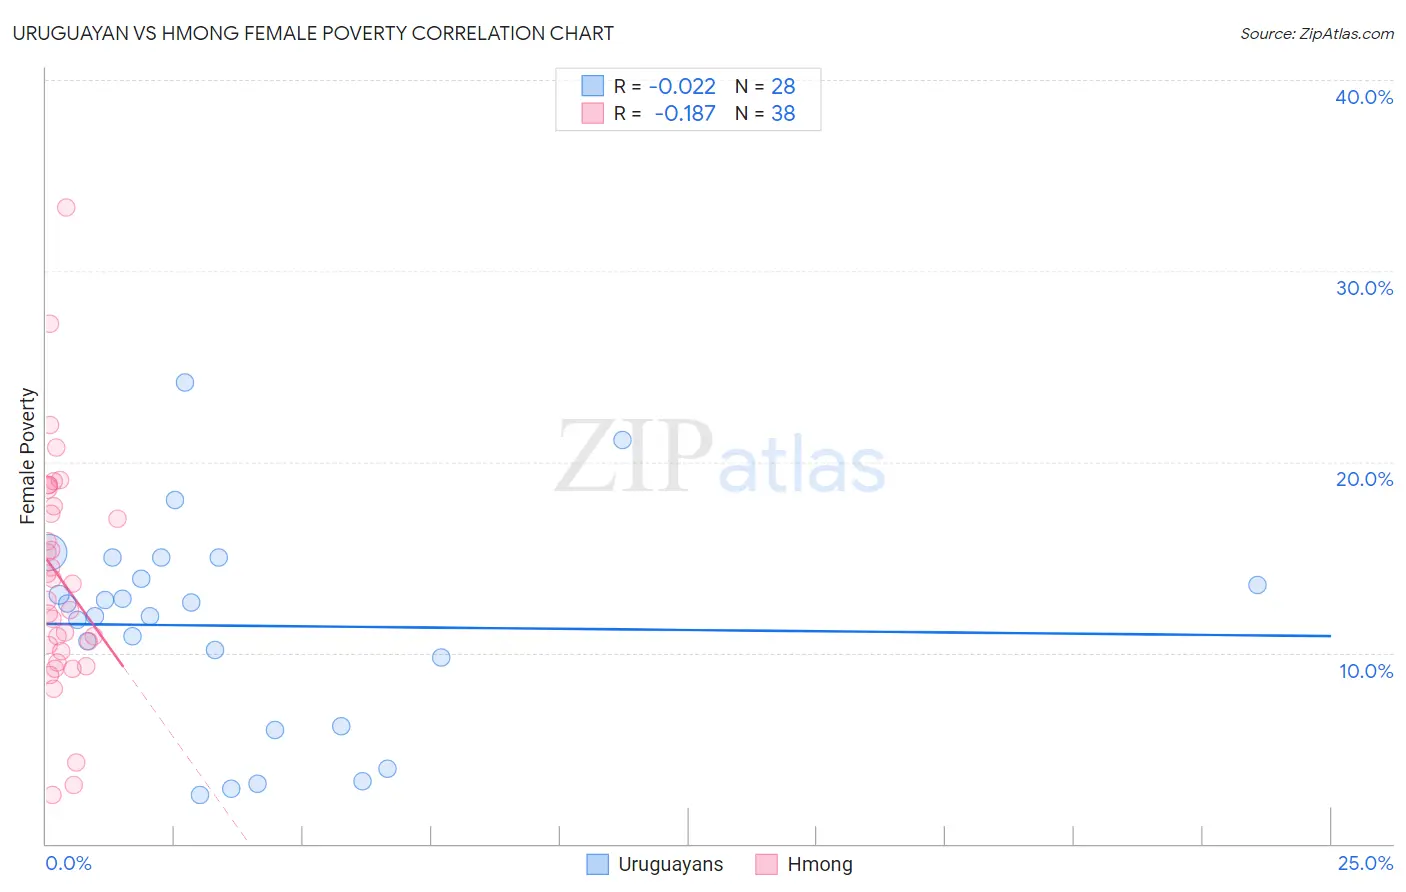
Uruguayan vs Hmong Female Poverty Correlation Chart
The statistical analysis conducted on geographies consisting of 144,759,999 people shows no correlation between the proportion of Uruguayans and poverty level among females in the United States with a correlation coefficient (R) of -0.022 and weighted average of 13.6%. Similarly, the statistical analysis conducted on geographies consisting of 24,669,739 people shows a poor negative correlation between the proportion of Hmong and poverty level among females in the United States with a correlation coefficient (R) of -0.187 and weighted average of 13.9%, a difference of 2.2%.
Female Poverty Correlation Summary
| Measurement | Uruguayan | Hmong |
| Minimum | 2.5% | 2.5% |
| Maximum | 24.1% | 33.3% |
| Range | 21.6% | 30.8% |
| Mean | 11.4% | 13.9% |
| Median | 12.3% | 13.2% |
| Interquartile 25% (IQ1) | 8.0% | 10.1% |
| Interquartile 75% (IQ3) | 14.4% | 17.7% |
| Interquartile Range (IQR) | 6.5% | 7.6% |
| Standard Deviation (Sample) | 5.4% | 6.1% |
| Standard Deviation (Population) | 5.3% | 6.1% |
Demographics Similar to Uruguayans and Hmong by Female Poverty
In terms of female poverty, the demographic groups most similar to Uruguayans are Hawaiian (13.6%, a difference of 0.010%), Immigrants from Venezuela (13.6%, a difference of 0.11%), Immigrants from Portugal (13.6%, a difference of 0.17%), Immigrants from Cameroon (13.5%, a difference of 0.22%), and Sierra Leonean (13.7%, a difference of 0.69%). Similarly, the demographic groups most similar to Hmong are Immigrants from Kenya (13.9%, a difference of 0.010%), Spanish (13.9%, a difference of 0.050%), Immigrants from Western Asia (13.9%, a difference of 0.050%), Spaniard (13.9%, a difference of 0.32%), and Immigrants from Lebanon (13.8%, a difference of 0.60%).
| Demographics | Rating | Rank | Female Poverty |
| Immigrants | Cameroon | 42.0 /100 | #185 | Average 13.5% |
| Immigrants | Portugal | 41.5 /100 | #186 | Average 13.6% |
| Immigrants | Venezuela | 41.0 /100 | #187 | Average 13.6% |
| Hawaiians | 39.9 /100 | #188 | Fair 13.6% |
| Uruguayans | 39.8 /100 | #189 | Fair 13.6% |
| Sierra Leoneans | 33.1 /100 | #190 | Fair 13.7% |
| Immigrants | Kuwait | 32.7 /100 | #191 | Fair 13.7% |
| Immigrants | Costa Rica | 31.9 /100 | #192 | Fair 13.7% |
| Iraqis | 31.8 /100 | #193 | Fair 13.7% |
| Delaware | 31.1 /100 | #194 | Fair 13.7% |
| Immigrants | South America | 30.6 /100 | #195 | Fair 13.7% |
| South American Indians | 28.9 /100 | #196 | Fair 13.7% |
| Arabs | 28.6 /100 | #197 | Fair 13.7% |
| Immigrants | Uganda | 28.5 /100 | #198 | Fair 13.7% |
| Immigrants | Lebanon | 25.6 /100 | #199 | Fair 13.8% |
| Spanish | 21.4 /100 | #200 | Fair 13.9% |
| Immigrants | Kenya | 21.1 /100 | #201 | Fair 13.9% |
| Hmong | 21.1 /100 | #202 | Fair 13.9% |
| Immigrants | Western Asia | 20.7 /100 | #203 | Fair 13.9% |
| Spaniards | 18.9 /100 | #204 | Poor 13.9% |
| Ugandans | 15.4 /100 | #205 | Poor 14.0% |