Immigrants from Ghana vs Immigrants from Brazil Family Poverty

COMPARE

Immigrants from Ghana
Race
Ancestry
AfghanAfricanAlaska NativeAlaskan AthabascanAlbanianAleutAlsatianAmericanApacheArabArapahoArgentineanArmenianAssyrian/Chaldean/SyriacAustralianAustrianBahamianBangladeshiBarbadianBasqueBelgianBelizeanBermudanBhutaneseBlackfeetBolivianBrazilianBritishBritish West IndianBulgarianBurmeseCajunCambodianCanadianCape VerdeanCarpatho RusynCelticCentral AmericanCentral American IndianCherokeeCheyenneChickasawChileanChineseChippewaChoctawColombianColvilleComancheCosta RicanCreeCreekCroatianCrowCubanCypriotCzechCzechoslovakianDanishDelawareDominicanDutchDutch West IndianEastern EuropeanEcuadorianEgyptianEnglishEstonianEthiopianEuropeanFijianFilipinoFinnishFrenchFrench American IndianFrench CanadianGermanGerman RussianGhanaianGreekGuamanian/ChamorroGuatemalanGuyaneseHaitianHmongHonduranHopiHoumaHungarianIcelanderIndian (Asian)IndonesianInupiatIranianIraqiIrishIroquoisIsraeliItalianJamaicanJapaneseJordanianKenyanKiowaKoreanLaotianLatvianLebaneseLiberianLithuanianLumbeeLuxembourgerMacedonianMalaysianMalteseMarshalleseMenomineeMexicanMexican American IndianMongolianMoroccanNative HawaiianNavajoNepaleseNew ZealanderNicaraguanNigerianNorthern EuropeanNorwegianOkinawanOsageOttawaPaiutePakistaniPalestinianPanamanianParaguayanPennsylvania GermanPeruvianPimaPolishPortuguesePotawatomiPuebloPuerto RicanPuget Sound SalishRomanianRussianSalvadoranSamoanScandinavianScotch-IrishScottishSeminoleSenegaleseSerbianShoshoneSierra LeoneanSiouxSlavicSlovakSloveneSomaliSouth AfricanSouth AmericanSouth American IndianSoviet UnionSpaniardSpanishSpanish AmericanSpanish American IndianSri LankanSubsaharan AfricanSudaneseSwedishSwissSyrianTaiwaneseThaiTlingit-HaidaTohono O'OdhamTonganTrinidadian and TobagonianTsimshianTurkishU.S. Virgin IslanderUgandanUkrainianUruguayanUteVenezuelanVietnameseWelshWest IndianYakamaYaquiYugoslavianYumanYup'ikZimbabwean
Immigration
NonimmigrantsImmigrantsAfghanistanAfricaAlbaniaArgentinaArmeniaAsiaAustraliaAustriaBahamasBangladeshBarbadosBelarusBelgiumBelizeBoliviaBosnia and HerzegovinaBulgariaBurma/MyanmarCabo VerdeCambodiaCameroonCanadaCaribbeanCentral AmericaChileChinaColombiaCongoCosta RicaCroatiaCubaCzechoslovakiaDenmarkDominicaDominican RepublicEastern AfricaEastern AsiaEastern EuropeEcuadorEgyptEl SalvadorEnglandEritreaEthiopiaEuropeFijiFranceGermanyGhanaGreeceGrenadaGuatemalaGuyanaHaitiHondurasHong KongHungaryIndiaIndonesiaIranIraqIrelandIsraelItalyJamaicaJapanJordanKazakhstanKenyaKoreaKuwaitLaosLatin AmericaLatviaLebanonLiberiaLithuaniaMalaysiaMexicoMicronesiaMiddle AfricaMoldovaMoroccoNepalNetherlandsNicaraguaNigeriaNorth AmericaNorth MacedoniaNorthern AfricaNorthern EuropeNorwayOceaniaPakistanPanamaPeruPhilippinesPolandPortugalRomaniaRussiaSaudi ArabiaScotlandSenegalSerbiaSierra LeoneSingaporeSomaliaSouth AfricaSouth AmericaSouth Central AsiaSouth Eastern AsiaSouthern EuropeSpainSri LankaSt. Vincent and the GrenadinesSudanSwedenSwitzerlandSyriaTaiwanThailandTrinidad and TobagoTurkeyUgandaUkraineUruguayUzbekistanVenezuelaVietnamWest IndiesWestern AfricaWestern AsiaWestern EuropeYemenZaireZimbabweAzores
Immigrants from Brazil
Race
Ancestry
AfghanAfricanAlaska NativeAlaskan AthabascanAlbanianAleutAlsatianAmericanApacheArabArapahoArgentineanArmenianAssyrian/Chaldean/SyriacAustralianAustrianBahamianBangladeshiBarbadianBasqueBelgianBelizeanBermudanBhutaneseBlackfeetBolivianBrazilianBritishBritish West IndianBulgarianBurmeseCajunCambodianCanadianCape VerdeanCarpatho RusynCelticCentral AmericanCentral American IndianCherokeeCheyenneChickasawChileanChineseChippewaChoctawColombianColvilleComancheCosta RicanCreeCreekCroatianCrowCubanCypriotCzechCzechoslovakianDanishDelawareDominicanDutchDutch West IndianEastern EuropeanEcuadorianEgyptianEnglishEstonianEthiopianEuropeanFijianFilipinoFinnishFrenchFrench American IndianFrench CanadianGermanGerman RussianGhanaianGreekGuamanian/ChamorroGuatemalanGuyaneseHaitianHmongHonduranHopiHoumaHungarianIcelanderIndian (Asian)IndonesianInupiatIranianIraqiIrishIroquoisIsraeliItalianJamaicanJapaneseJordanianKenyanKiowaKoreanLaotianLatvianLebaneseLiberianLithuanianLumbeeLuxembourgerMacedonianMalaysianMalteseMarshalleseMenomineeMexicanMexican American IndianMongolianMoroccanNative HawaiianNavajoNepaleseNew ZealanderNicaraguanNigerianNorthern EuropeanNorwegianOkinawanOsageOttawaPaiutePakistaniPalestinianPanamanianParaguayanPennsylvania GermanPeruvianPimaPolishPortuguesePotawatomiPuebloPuerto RicanPuget Sound SalishRomanianRussianSalvadoranSamoanScandinavianScotch-IrishScottishSeminoleSenegaleseSerbianShoshoneSierra LeoneanSiouxSlavicSlovakSloveneSomaliSouth AfricanSouth AmericanSouth American IndianSoviet UnionSpaniardSpanishSpanish AmericanSpanish American IndianSri LankanSubsaharan AfricanSudaneseSwedishSwissSyrianTaiwaneseThaiTlingit-HaidaTohono O'OdhamTonganTrinidadian and TobagonianTsimshianTurkishU.S. Virgin IslanderUgandanUkrainianUruguayanUteVenezuelanVietnameseWelshWest IndianYakamaYaquiYugoslavianYumanYup'ikZimbabwean
Immigration
NonimmigrantsImmigrantsAfghanistanAfricaAlbaniaArgentinaArmeniaAsiaAustraliaAustriaBahamasBangladeshBarbadosBelarusBelgiumBelizeBoliviaBosnia and HerzegovinaBrazilBulgariaBurma/MyanmarCabo VerdeCambodiaCameroonCanadaCaribbeanCentral AmericaChileChinaColombiaCongoCosta RicaCroatiaCubaCzechoslovakiaDenmarkDominicaDominican RepublicEastern AfricaEastern AsiaEastern EuropeEcuadorEgyptEl SalvadorEnglandEritreaEthiopiaEuropeFijiFranceGermanyGreeceGrenadaGuatemalaGuyanaHaitiHondurasHong KongHungaryIndiaIndonesiaIranIraqIrelandIsraelItalyJamaicaJapanJordanKazakhstanKenyaKoreaKuwaitLaosLatin AmericaLatviaLebanonLiberiaLithuaniaMalaysiaMexicoMicronesiaMiddle AfricaMoldovaMoroccoNepalNetherlandsNicaraguaNigeriaNorth AmericaNorth MacedoniaNorthern AfricaNorthern EuropeNorwayOceaniaPakistanPanamaPeruPhilippinesPolandPortugalRomaniaRussiaSaudi ArabiaScotlandSenegalSerbiaSierra LeoneSingaporeSomaliaSouth AfricaSouth AmericaSouth Central AsiaSouth Eastern AsiaSouthern EuropeSpainSri LankaSt. Vincent and the GrenadinesSudanSwedenSwitzerlandSyriaTaiwanThailandTrinidad and TobagoTurkeyUgandaUkraineUruguayUzbekistanVenezuelaVietnamWest IndiesWestern AfricaWestern AsiaWestern EuropeYemenZaireZimbabweAzores
Family Poverty
Income
Poverty
Unemployment
Labor Participation
Family Structure
Vehicle Availability
Education Level
Disability

Family Poverty Comparison

Immigrants from Ghana

Immigrants from Brazil

Tragic
Excellent
10.8%
FAMILY POVERTY
0.2/ 100
METRIC RATING
257th/ 347
METRIC RANK
8.5%
FAMILY POVERTY
86.3/ 100
METRIC RATING
136th/ 347
METRIC RANK

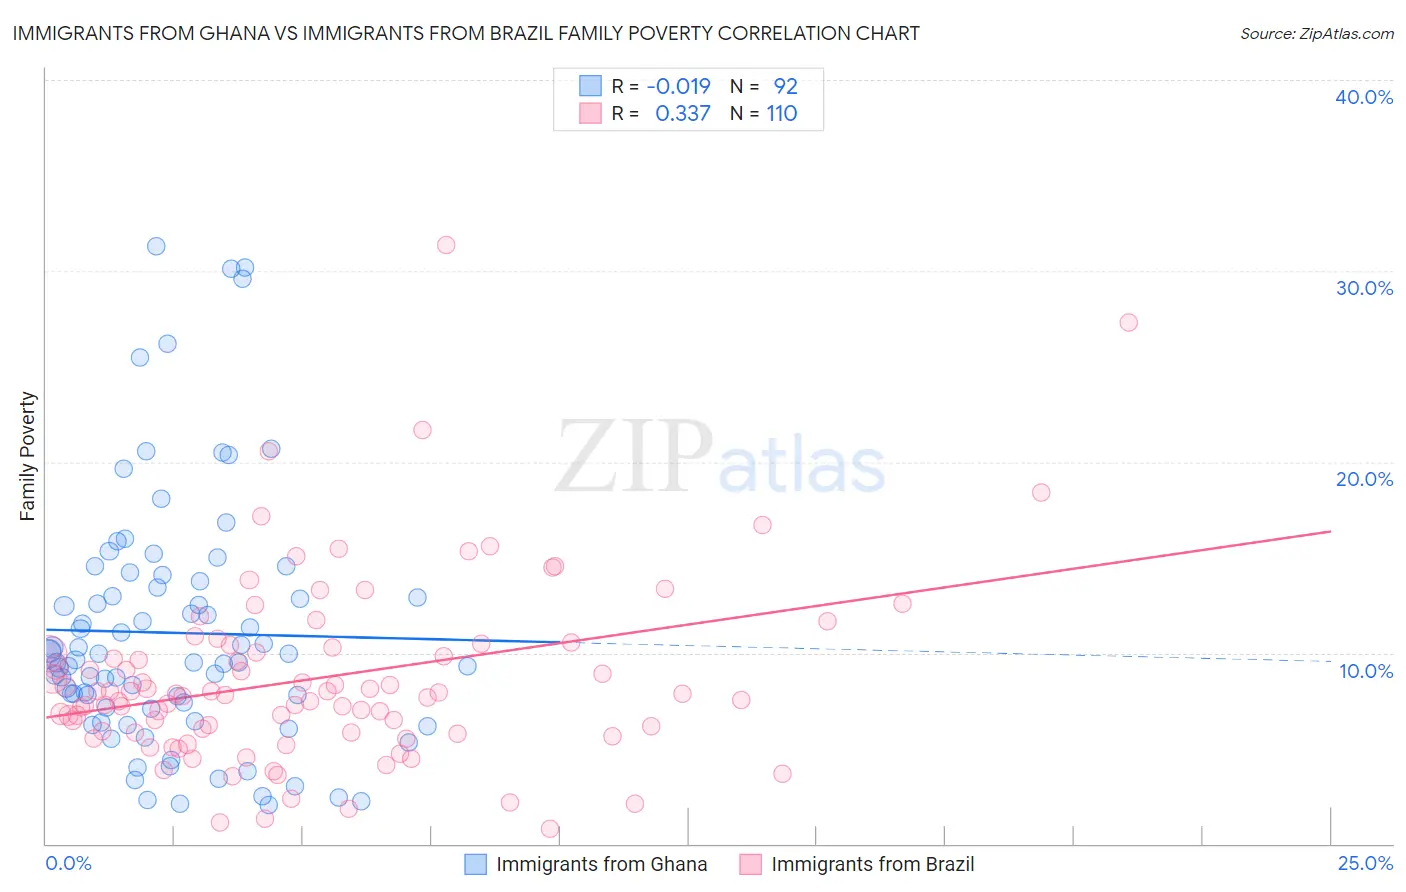
Immigrants from Ghana vs Immigrants from Brazil Family Poverty Correlation Chart

The statistical analysis conducted on geographies consisting of 199,614,936 people shows no correlation between the proportion of Immigrants from Ghana and poverty level among families in the United States with a correlation coefficient (R) of -0.019 and weighted average of 10.8%. Similarly, the statistical analysis conducted on geographies consisting of 342,227,050 people shows a mild positive correlation between the proportion of Immigrants from Brazil and poverty level among families in the United States with a correlation coefficient (R) of 0.337 and weighted average of 8.5%, a difference of 28.2%.
Immigrants from Ghana vs Immigrants from Brazil Family Poverty

Family Poverty Correlation Summary

MeasurementImmigrants from GhanaImmigrants from Brazil
Minimum2.0%0.81%
Maximum31.3%31.4%
Range29.3%30.6%
Mean11.0%8.7%
Median9.6%7.8%
Interquartile 25% (IQ1)7.1%5.9%
Interquartile 75% (IQ3)13.6%10.3%
Interquartile Range (IQR)6.5%4.4%
Standard Deviation (Sample)6.5%4.9%
Standard Deviation (Population)6.5%4.9%

Similar Demographics by Family Poverty

Demographics Similar to Immigrants from Ghana by Family Poverty

In terms of family poverty, the demographic groups most similar to Immigrants from Ghana are Subsaharan African (10.9%, a difference of 0.030%), Chickasaw (10.8%, a difference of 0.040%), Mexican American Indian (10.9%, a difference of 0.070%), Immigrants from Liberia (10.8%, a difference of 0.30%), and Bangladeshi (10.9%, a difference of 0.42%).
DemographicsRating | RankFamily Poverty
Salvadorans
0.3
/100
|
#250
Tragic
10.7%
Iroquois
0.3
/100
|
#251
Tragic
10.7%
Immigrants | Zaire
0.3
/100
|
#252
Tragic
10.7%
Immigrants | Western Africa
0.3
/100
|
#253
Tragic
10.7%
Ecuadorians
0.2
/100
|
#254
Tragic
10.8%
Immigrants | Liberia
0.2
/100
|
#255
Tragic
10.8%
Chickasaw
0.2
/100
|
#256
Tragic
10.8%
Immigrants | Ghana
0.2
/100
|
#257
Tragic
10.8%
Sub-Saharan Africans
0.2
/100
|
#258
Tragic
10.9%
Mexican American Indians
0.2
/100
|
#259
Tragic
10.9%
Bangladeshis
0.2
/100
|
#260
Tragic
10.9%
Shoshone
0.2
/100
|
#261
Tragic
10.9%
Spanish American Indians
0.2
/100
|
#262
Tragic
10.9%
Cape Verdeans
0.1
/100
|
#263
Tragic
10.9%
Trinidadians and Tobagonians
0.1
/100
|
#264
Tragic
10.9%

Demographics Similar to Immigrants from Brazil by Family Poverty

In terms of family poverty, the demographic groups most similar to Immigrants from Brazil are Immigrants from Malaysia (8.5%, a difference of 0.040%), Chilean (8.5%, a difference of 0.080%), Immigrants from Southern Europe (8.5%, a difference of 0.080%), Sri Lankan (8.5%, a difference of 0.090%), and Armenian (8.5%, a difference of 0.48%).
DemographicsRating | RankFamily Poverty
Portuguese
89.2
/100
|
#129
Excellent
8.4%
Immigrants | Bosnia and Herzegovina
88.6
/100
|
#130
Excellent
8.4%
Puget Sound Salish
88.6
/100
|
#131
Excellent
8.4%
Immigrants | Argentina
88.2
/100
|
#132
Excellent
8.4%
Sri Lankans
86.6
/100
|
#133
Excellent
8.5%
Chileans
86.6
/100
|
#134
Excellent
8.5%
Immigrants | Malaysia
86.5
/100
|
#135
Excellent
8.5%
Immigrants | Brazil
86.3
/100
|
#136
Excellent
8.5%
Immigrants | Southern Europe
86.0
/100
|
#137
Excellent
8.5%
Armenians
84.6
/100
|
#138
Excellent
8.5%
Immigrants | Nepal
84.2
/100
|
#139
Excellent
8.5%
Immigrants | Kazakhstan
84.1
/100
|
#140
Excellent
8.5%
Immigrants | Ukraine
83.9
/100
|
#141
Excellent
8.5%
Yugoslavians
83.5
/100
|
#142
Excellent
8.5%
Immigrants | Germany
83.3
/100
|
#143
Excellent
8.5%