Immigrants from Honduras vs Immigrants from Brazil Family Poverty
COMPARE
Immigrants from Honduras
Immigrants from Brazil
Family Poverty
Family Poverty Comparison
Immigrants from Honduras
Immigrants from Brazil
12.7%
FAMILY POVERTY
0.0/ 100
METRIC RATING
322nd/ 347
METRIC RANK
8.5%
FAMILY POVERTY
86.3/ 100
METRIC RATING
136th/ 347
METRIC RANK
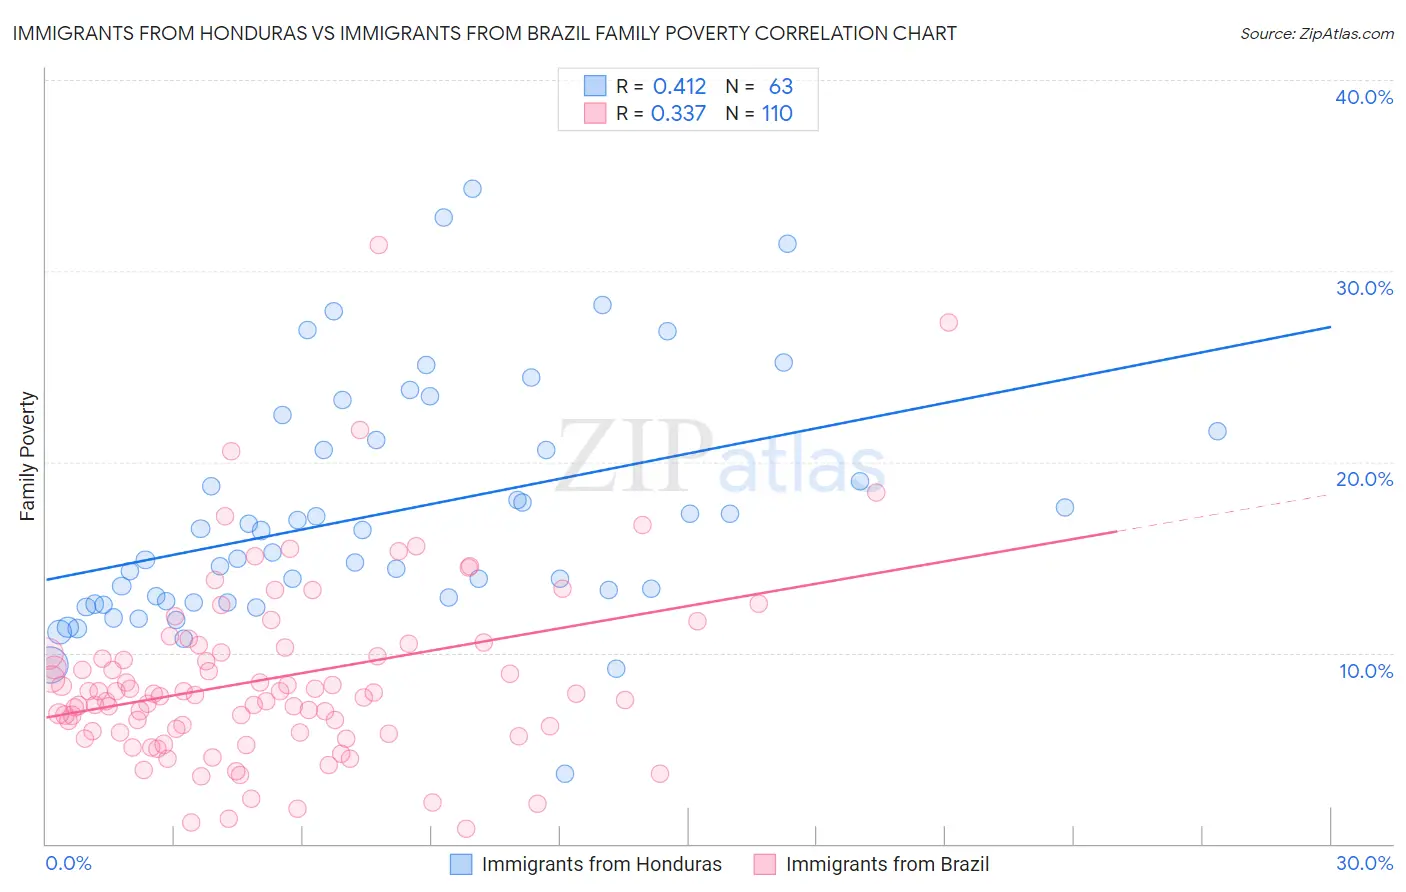
Immigrants from Honduras vs Immigrants from Brazil Family Poverty Correlation Chart
The statistical analysis conducted on geographies consisting of 322,221,893 people shows a moderate positive correlation between the proportion of Immigrants from Honduras and poverty level among families in the United States with a correlation coefficient (R) of 0.412 and weighted average of 12.7%. Similarly, the statistical analysis conducted on geographies consisting of 342,227,050 people shows a mild positive correlation between the proportion of Immigrants from Brazil and poverty level among families in the United States with a correlation coefficient (R) of 0.337 and weighted average of 8.5%, a difference of 49.6%.
Family Poverty Correlation Summary
| Measurement | Immigrants from Honduras | Immigrants from Brazil |
| Minimum | 3.7% | 0.81% |
| Maximum | 34.3% | 31.4% |
| Range | 30.6% | 30.6% |
| Mean | 17.2% | 8.7% |
| Median | 15.3% | 7.8% |
| Interquartile 25% (IQ1) | 12.7% | 5.9% |
| Interquartile 75% (IQ3) | 21.1% | 10.3% |
| Interquartile Range (IQR) | 8.5% | 4.4% |
| Standard Deviation (Sample) | 6.2% | 4.9% |
| Standard Deviation (Population) | 6.2% | 4.9% |
Similar Demographics by Family Poverty
Demographics Similar to Immigrants from Honduras by Family Poverty
In terms of family poverty, the demographic groups most similar to Immigrants from Honduras are Arapaho (12.7%, a difference of 0.10%), Menominee (12.7%, a difference of 0.54%), Immigrants from Dominica (12.7%, a difference of 0.62%), Inupiat (12.5%, a difference of 1.6%), and British West Indian (12.4%, a difference of 2.1%).
| Demographics | Rating | Rank | Family Poverty |
| Immigrants | Mexico | 0.0 /100 | #315 | Tragic 12.3% |
| Hondurans | 0.0 /100 | #316 | Tragic 12.4% |
| Immigrants | Grenada | 0.0 /100 | #317 | Tragic 12.4% |
| U.S. Virgin Islanders | 0.0 /100 | #318 | Tragic 12.4% |
| British West Indians | 0.0 /100 | #319 | Tragic 12.4% |
| Inupiat | 0.0 /100 | #320 | Tragic 12.5% |
| Arapaho | 0.0 /100 | #321 | Tragic 12.7% |
| Immigrants | Honduras | 0.0 /100 | #322 | Tragic 12.7% |
| Menominee | 0.0 /100 | #323 | Tragic 12.7% |
| Immigrants | Dominica | 0.0 /100 | #324 | Tragic 12.7% |
| Paiute | 0.0 /100 | #325 | Tragic 13.0% |
| Colville | 0.0 /100 | #326 | Tragic 13.0% |
| Yakama | 0.0 /100 | #327 | Tragic 13.1% |
| Central American Indians | 0.0 /100 | #328 | Tragic 13.3% |
| Blacks/African Americans | 0.0 /100 | #329 | Tragic 13.3% |
Demographics Similar to Immigrants from Brazil by Family Poverty
In terms of family poverty, the demographic groups most similar to Immigrants from Brazil are Immigrants from Malaysia (8.5%, a difference of 0.040%), Chilean (8.5%, a difference of 0.080%), Immigrants from Southern Europe (8.5%, a difference of 0.080%), Sri Lankan (8.5%, a difference of 0.090%), and Armenian (8.5%, a difference of 0.48%).
| Demographics | Rating | Rank | Family Poverty |
| Portuguese | 89.2 /100 | #129 | Excellent 8.4% |
| Immigrants | Bosnia and Herzegovina | 88.6 /100 | #130 | Excellent 8.4% |
| Puget Sound Salish | 88.6 /100 | #131 | Excellent 8.4% |
| Immigrants | Argentina | 88.2 /100 | #132 | Excellent 8.4% |
| Sri Lankans | 86.6 /100 | #133 | Excellent 8.5% |
| Chileans | 86.6 /100 | #134 | Excellent 8.5% |
| Immigrants | Malaysia | 86.5 /100 | #135 | Excellent 8.5% |
| Immigrants | Brazil | 86.3 /100 | #136 | Excellent 8.5% |
| Immigrants | Southern Europe | 86.0 /100 | #137 | Excellent 8.5% |
| Armenians | 84.6 /100 | #138 | Excellent 8.5% |
| Immigrants | Nepal | 84.2 /100 | #139 | Excellent 8.5% |
| Immigrants | Kazakhstan | 84.1 /100 | #140 | Excellent 8.5% |
| Immigrants | Ukraine | 83.9 /100 | #141 | Excellent 8.5% |
| Yugoslavians | 83.5 /100 | #142 | Excellent 8.5% |
| Immigrants | Germany | 83.3 /100 | #143 | Excellent 8.5% |