Immigrants from Ghana vs Chippewa Median Household Income
COMPARE
Immigrants from Ghana
Chippewa
Median Household Income
Median Household Income Comparison
Immigrants from Ghana
Chippewa
$81,489
MEDIAN HOUSEHOLD INCOME
9.0/ 100
METRIC RATING
221st/ 347
METRIC RANK
$70,539
MEDIAN HOUSEHOLD INCOME
0.0/ 100
METRIC RATING
318th/ 347
METRIC RANK
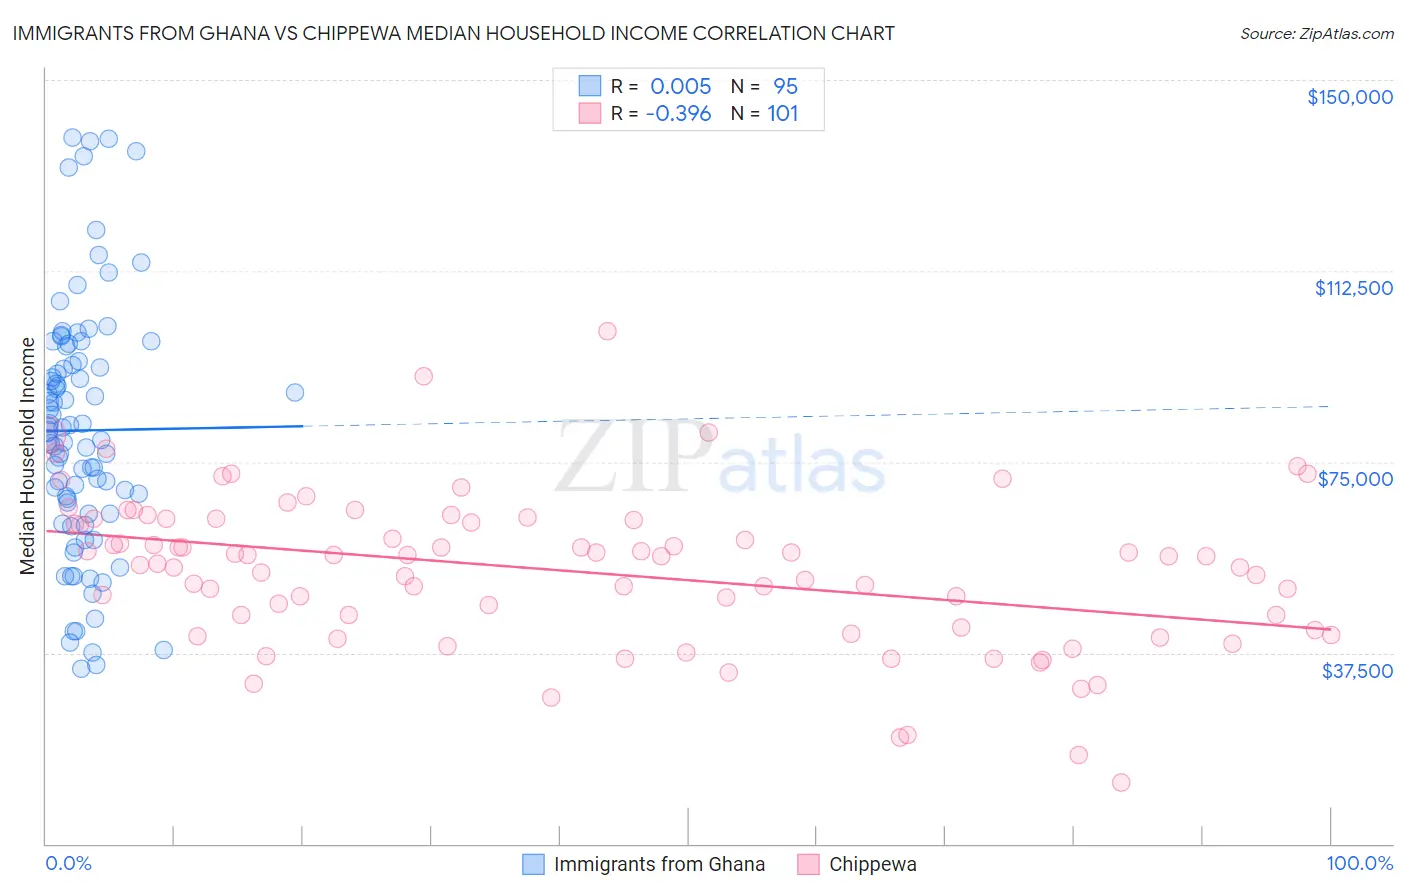
Immigrants from Ghana vs Chippewa Median Household Income Correlation Chart
The statistical analysis conducted on geographies consisting of 199,784,563 people shows no correlation between the proportion of Immigrants from Ghana and median household income in the United States with a correlation coefficient (R) of 0.005 and weighted average of $81,489. Similarly, the statistical analysis conducted on geographies consisting of 214,988,479 people shows a mild negative correlation between the proportion of Chippewa and median household income in the United States with a correlation coefficient (R) of -0.396 and weighted average of $70,539, a difference of 15.5%.
Median Household Income Correlation Summary
| Measurement | Immigrants from Ghana | Chippewa |
| Minimum | $34,375 | $12,000 |
| Maximum | $138,703 | $100,625 |
| Range | $104,328 | $88,625 |
| Mean | $81,173 | $53,554 |
| Median | $81,072 | $56,473 |
| Interquartile 25% (IQ1) | $64,873 | $42,264 |
| Interquartile 75% (IQ3) | $94,696 | $63,716 |
| Interquartile Range (IQR) | $29,822 | $21,452 |
| Standard Deviation (Sample) | $24,293 | $15,182 |
| Standard Deviation (Population) | $24,164 | $15,107 |
Similar Demographics by Median Household Income
Demographics Similar to Immigrants from Ghana by Median Household Income
In terms of median household income, the demographic groups most similar to Immigrants from Ghana are Immigrants from Venezuela ($81,506, a difference of 0.020%), Nigerian ($81,725, a difference of 0.29%), Immigrants from Nigeria ($81,236, a difference of 0.31%), Immigrants from El Salvador ($81,213, a difference of 0.34%), and Malaysian ($81,064, a difference of 0.52%).
| Demographics | Rating | Rank | Median Household Income |
| Panamanians | 14.0 /100 | #214 | Poor $82,272 |
| Vietnamese | 13.8 /100 | #215 | Poor $82,248 |
| Yugoslavians | 13.3 /100 | #216 | Poor $82,186 |
| Ecuadorians | 12.5 /100 | #217 | Poor $82,070 |
| Whites/Caucasians | 12.2 /100 | #218 | Poor $82,029 |
| Nigerians | 10.3 /100 | #219 | Poor $81,725 |
| Immigrants | Venezuela | 9.0 /100 | #220 | Tragic $81,506 |
| Immigrants | Ghana | 9.0 /100 | #221 | Tragic $81,489 |
| Immigrants | Nigeria | 7.7 /100 | #222 | Tragic $81,236 |
| Immigrants | El Salvador | 7.6 /100 | #223 | Tragic $81,213 |
| Malaysians | 7.0 /100 | #224 | Tragic $81,064 |
| Scotch-Irish | 6.6 /100 | #225 | Tragic $80,972 |
| Immigrants | Panama | 6.2 /100 | #226 | Tragic $80,873 |
| Guyanese | 5.7 /100 | #227 | Tragic $80,734 |
| Immigrants | Bangladesh | 5.7 /100 | #228 | Tragic $80,722 |
Demographics Similar to Chippewa by Median Household Income
In terms of median household income, the demographic groups most similar to Chippewa are Cajun ($70,605, a difference of 0.090%), Immigrants from Dominican Republic ($70,208, a difference of 0.47%), Apache ($70,927, a difference of 0.55%), Ottawa ($70,984, a difference of 0.63%), and Colville ($70,094, a difference of 0.63%).
| Demographics | Rating | Rank | Median Household Income |
| Immigrants | Zaire | 0.0 /100 | #311 | Tragic $71,801 |
| Immigrants | Honduras | 0.0 /100 | #312 | Tragic $71,452 |
| Immigrants | Bahamas | 0.0 /100 | #313 | Tragic $71,349 |
| Dominicans | 0.0 /100 | #314 | Tragic $71,302 |
| Ottawa | 0.0 /100 | #315 | Tragic $70,984 |
| Apache | 0.0 /100 | #316 | Tragic $70,927 |
| Cajuns | 0.0 /100 | #317 | Tragic $70,605 |
| Chippewa | 0.0 /100 | #318 | Tragic $70,539 |
| Immigrants | Dominican Republic | 0.0 /100 | #319 | Tragic $70,208 |
| Colville | 0.0 /100 | #320 | Tragic $70,094 |
| Chickasaw | 0.0 /100 | #321 | Tragic $70,005 |
| Choctaw | 0.0 /100 | #322 | Tragic $69,947 |
| Bahamians | 0.0 /100 | #323 | Tragic $69,726 |
| Yup'ik | 0.0 /100 | #324 | Tragic $69,695 |
| Seminole | 0.0 /100 | #325 | Tragic $69,420 |