Immigrants from Fiji vs European Receiving Food Stamps
COMPARE
Immigrants from Fiji
European
Receiving Food Stamps
Receiving Food Stamps Comparison
Immigrants from Fiji
Europeans
12.1%
RECEIVING FOOD STAMPS
27.8/ 100
METRIC RATING
193rd/ 347
METRIC RANK
9.5%
RECEIVING FOOD STAMPS
99.6/ 100
METRIC RATING
37th/ 347
METRIC RANK
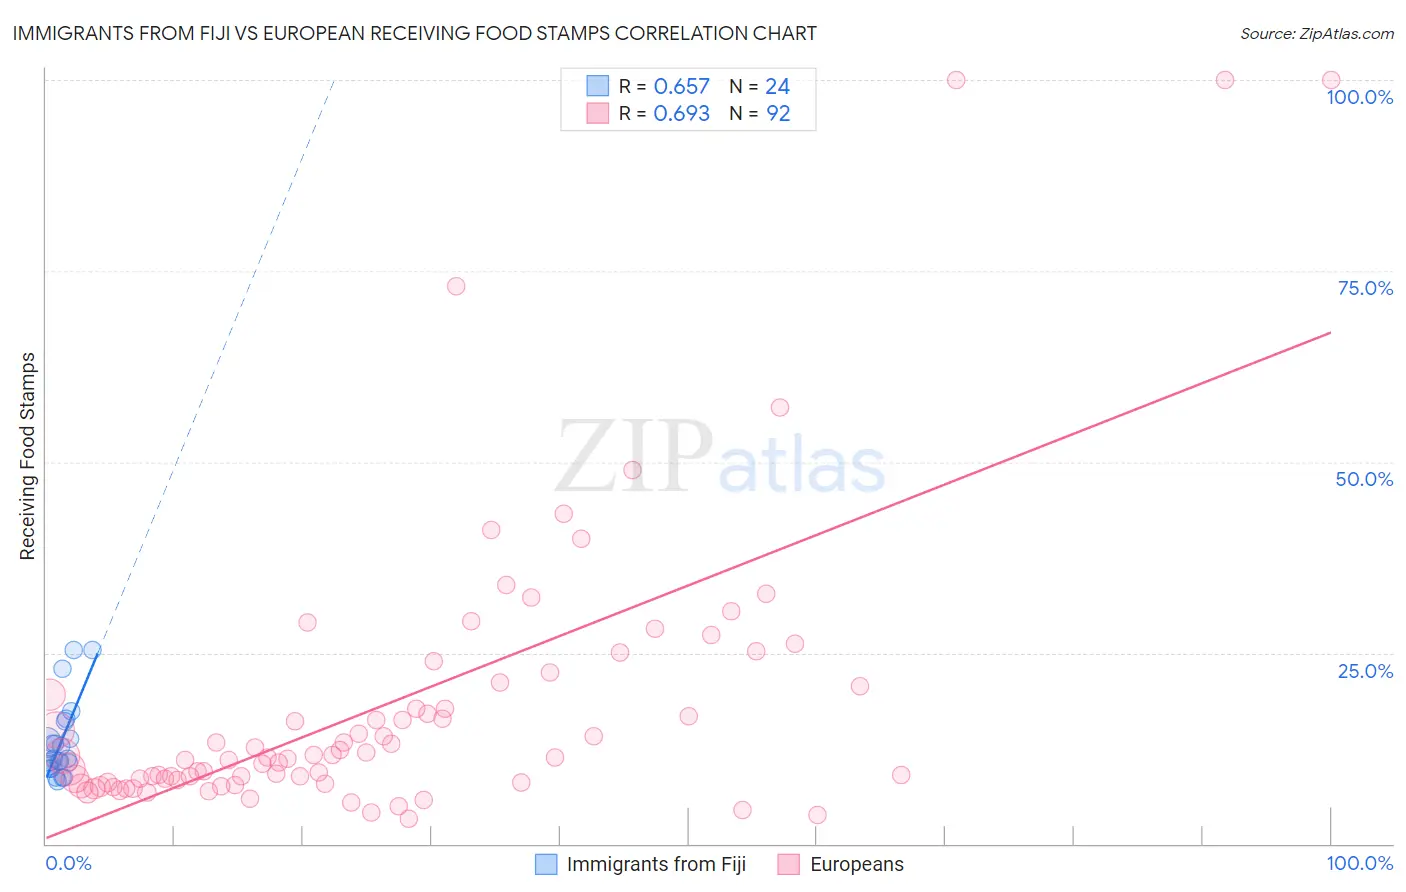
Immigrants from Fiji vs European Receiving Food Stamps Correlation Chart
The statistical analysis conducted on geographies consisting of 93,752,896 people shows a significant positive correlation between the proportion of Immigrants from Fiji and percentage of population receiving government assistance and/or food stamps in the United States with a correlation coefficient (R) of 0.657 and weighted average of 12.1%. Similarly, the statistical analysis conducted on geographies consisting of 558,520,577 people shows a significant positive correlation between the proportion of Europeans and percentage of population receiving government assistance and/or food stamps in the United States with a correlation coefficient (R) of 0.693 and weighted average of 9.5%, a difference of 27.8%.
Receiving Food Stamps Correlation Summary
| Measurement | Immigrants from Fiji | European |
| Minimum | 8.3% | 3.2% |
| Maximum | 25.4% | 100.0% |
| Range | 17.2% | 96.8% |
| Mean | 13.3% | 18.5% |
| Median | 11.1% | 11.4% |
| Interquartile 25% (IQ1) | 10.0% | 8.2% |
| Interquartile 75% (IQ3) | 14.9% | 20.8% |
| Interquartile Range (IQR) | 4.9% | 12.6% |
| Standard Deviation (Sample) | 5.0% | 19.3% |
| Standard Deviation (Population) | 4.9% | 19.2% |
Similar Demographics by Receiving Food Stamps
Demographics Similar to Immigrants from Fiji by Receiving Food Stamps
In terms of receiving food stamps, the demographic groups most similar to Immigrants from Fiji are Immigrants from Sudan (12.1%, a difference of 0.12%), American (12.2%, a difference of 0.18%), Iraqi (12.2%, a difference of 0.21%), Delaware (12.2%, a difference of 0.28%), and Immigrants from Costa Rica (12.2%, a difference of 0.42%).
| Demographics | Rating | Rank | Receiving Food Stamps |
| Spanish | 36.9 /100 | #186 | Fair 12.0% |
| Albanians | 35.4 /100 | #187 | Fair 12.0% |
| Sudanese | 33.4 /100 | #188 | Fair 12.0% |
| Immigrants | Cameroon | 32.5 /100 | #189 | Fair 12.0% |
| Immigrants | Peru | 32.2 /100 | #190 | Fair 12.0% |
| Venezuelans | 32.1 /100 | #191 | Fair 12.0% |
| Samoans | 31.0 /100 | #192 | Fair 12.1% |
| Immigrants | Fiji | 27.8 /100 | #193 | Fair 12.1% |
| Immigrants | Sudan | 27.1 /100 | #194 | Fair 12.1% |
| Americans | 26.7 /100 | #195 | Fair 12.2% |
| Iraqis | 26.6 /100 | #196 | Fair 12.2% |
| Delaware | 26.1 /100 | #197 | Fair 12.2% |
| Immigrants | Costa Rica | 25.4 /100 | #198 | Fair 12.2% |
| Portuguese | 25.1 /100 | #199 | Fair 12.2% |
| Sierra Leoneans | 23.6 /100 | #200 | Fair 12.2% |
Demographics Similar to Europeans by Receiving Food Stamps
In terms of receiving food stamps, the demographic groups most similar to Europeans are Estonian (9.5%, a difference of 0.070%), Immigrants from Austria (9.5%, a difference of 0.090%), Turkish (9.5%, a difference of 0.12%), Zimbabwean (9.5%, a difference of 0.13%), and Immigrants from Sri Lanka (9.5%, a difference of 0.29%).
| Demographics | Rating | Rank | Receiving Food Stamps |
| Immigrants | Sweden | 99.7 /100 | #30 | Exceptional 9.3% |
| Immigrants | Eastern Asia | 99.7 /100 | #31 | Exceptional 9.3% |
| Bolivians | 99.7 /100 | #32 | Exceptional 9.3% |
| Zimbabweans | 99.6 /100 | #33 | Exceptional 9.5% |
| Turks | 99.6 /100 | #34 | Exceptional 9.5% |
| Immigrants | Austria | 99.6 /100 | #35 | Exceptional 9.5% |
| Estonians | 99.6 /100 | #36 | Exceptional 9.5% |
| Europeans | 99.6 /100 | #37 | Exceptional 9.5% |
| Immigrants | Sri Lanka | 99.5 /100 | #38 | Exceptional 9.5% |
| Immigrants | Bolivia | 99.5 /100 | #39 | Exceptional 9.5% |
| Immigrants | Netherlands | 99.5 /100 | #40 | Exceptional 9.5% |
| Cambodians | 99.5 /100 | #41 | Exceptional 9.5% |
| Immigrants | China | 99.5 /100 | #42 | Exceptional 9.6% |
| Croatians | 99.5 /100 | #43 | Exceptional 9.6% |
| Immigrants | Denmark | 99.4 /100 | #44 | Exceptional 9.6% |