Belgian vs European Receiving Food Stamps
COMPARE
Belgian
European
Receiving Food Stamps
Receiving Food Stamps Comparison
Belgians
Europeans
10.2%
RECEIVING FOOD STAMPS
97.7/ 100
METRIC RATING
93rd/ 347
METRIC RANK
9.5%
RECEIVING FOOD STAMPS
99.6/ 100
METRIC RATING
37th/ 347
METRIC RANK
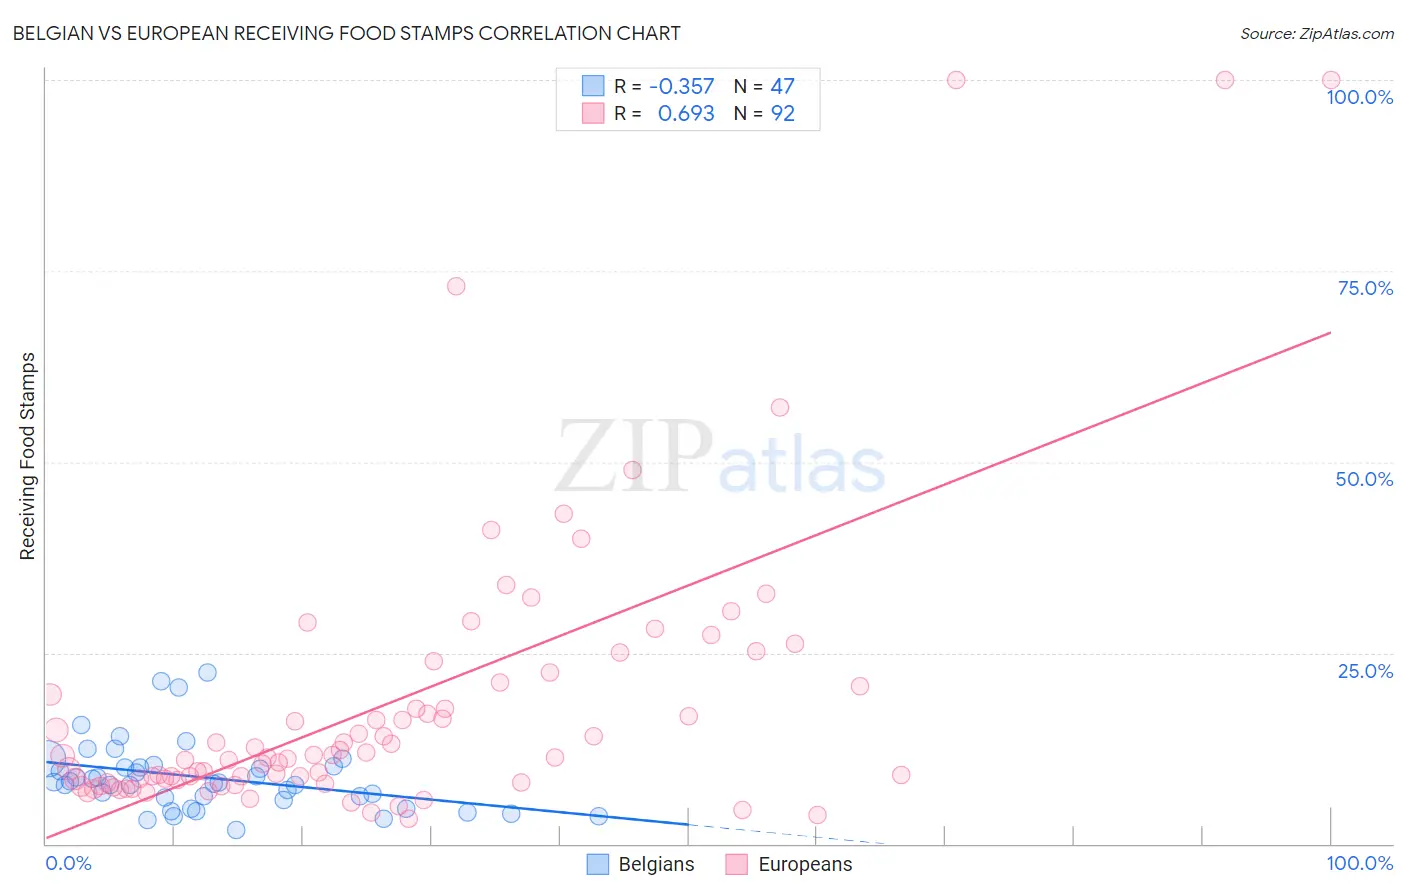
Belgian vs European Receiving Food Stamps Correlation Chart
The statistical analysis conducted on geographies consisting of 355,046,721 people shows a mild negative correlation between the proportion of Belgians and percentage of population receiving government assistance and/or food stamps in the United States with a correlation coefficient (R) of -0.357 and weighted average of 10.2%. Similarly, the statistical analysis conducted on geographies consisting of 558,520,577 people shows a significant positive correlation between the proportion of Europeans and percentage of population receiving government assistance and/or food stamps in the United States with a correlation coefficient (R) of 0.693 and weighted average of 9.5%, a difference of 7.4%.
Receiving Food Stamps Correlation Summary
| Measurement | Belgian | European |
| Minimum | 1.8% | 3.2% |
| Maximum | 22.4% | 100.0% |
| Range | 20.6% | 96.8% |
| Mean | 8.7% | 18.5% |
| Median | 8.1% | 11.4% |
| Interquartile 25% (IQ1) | 5.8% | 8.2% |
| Interquartile 75% (IQ3) | 10.2% | 20.8% |
| Interquartile Range (IQR) | 4.4% | 12.6% |
| Standard Deviation (Sample) | 4.6% | 19.3% |
| Standard Deviation (Population) | 4.5% | 19.2% |
Similar Demographics by Receiving Food Stamps
Demographics Similar to Belgians by Receiving Food Stamps
In terms of receiving food stamps, the demographic groups most similar to Belgians are Irish (10.2%, a difference of 0.38%), Jordanian (10.2%, a difference of 0.39%), Finnish (10.2%, a difference of 0.42%), Immigrants from Greece (10.3%, a difference of 0.53%), and Basque (10.3%, a difference of 0.55%).
| Demographics | Rating | Rank | Receiving Food Stamps |
| Immigrants | Norway | 98.4 /100 | #86 | Exceptional 10.0% |
| Egyptians | 98.4 /100 | #87 | Exceptional 10.0% |
| Immigrants | Kuwait | 98.4 /100 | #88 | Exceptional 10.0% |
| Immigrants | France | 98.3 /100 | #89 | Exceptional 10.1% |
| Finns | 97.9 /100 | #90 | Exceptional 10.2% |
| Jordanians | 97.9 /100 | #91 | Exceptional 10.2% |
| Irish | 97.9 /100 | #92 | Exceptional 10.2% |
| Belgians | 97.7 /100 | #93 | Exceptional 10.2% |
| Immigrants | Greece | 97.4 /100 | #94 | Exceptional 10.3% |
| Basques | 97.4 /100 | #95 | Exceptional 10.3% |
| Welsh | 97.3 /100 | #96 | Exceptional 10.3% |
| Czechoslovakians | 97.2 /100 | #97 | Exceptional 10.3% |
| Immigrants | Egypt | 97.1 /100 | #98 | Exceptional 10.3% |
| Serbians | 97.0 /100 | #99 | Exceptional 10.3% |
| Immigrants | Western Europe | 96.9 /100 | #100 | Exceptional 10.3% |
Demographics Similar to Europeans by Receiving Food Stamps
In terms of receiving food stamps, the demographic groups most similar to Europeans are Estonian (9.5%, a difference of 0.070%), Immigrants from Austria (9.5%, a difference of 0.090%), Turkish (9.5%, a difference of 0.12%), Zimbabwean (9.5%, a difference of 0.13%), and Immigrants from Sri Lanka (9.5%, a difference of 0.29%).
| Demographics | Rating | Rank | Receiving Food Stamps |
| Immigrants | Sweden | 99.7 /100 | #30 | Exceptional 9.3% |
| Immigrants | Eastern Asia | 99.7 /100 | #31 | Exceptional 9.3% |
| Bolivians | 99.7 /100 | #32 | Exceptional 9.3% |
| Zimbabweans | 99.6 /100 | #33 | Exceptional 9.5% |
| Turks | 99.6 /100 | #34 | Exceptional 9.5% |
| Immigrants | Austria | 99.6 /100 | #35 | Exceptional 9.5% |
| Estonians | 99.6 /100 | #36 | Exceptional 9.5% |
| Europeans | 99.6 /100 | #37 | Exceptional 9.5% |
| Immigrants | Sri Lanka | 99.5 /100 | #38 | Exceptional 9.5% |
| Immigrants | Bolivia | 99.5 /100 | #39 | Exceptional 9.5% |
| Immigrants | Netherlands | 99.5 /100 | #40 | Exceptional 9.5% |
| Cambodians | 99.5 /100 | #41 | Exceptional 9.5% |
| Immigrants | China | 99.5 /100 | #42 | Exceptional 9.6% |
| Croatians | 99.5 /100 | #43 | Exceptional 9.6% |
| Immigrants | Denmark | 99.4 /100 | #44 | Exceptional 9.6% |