Immigrants from Fiji vs Peruvian Receiving Food Stamps
COMPARE
Immigrants from Fiji
Peruvian
Receiving Food Stamps
Receiving Food Stamps Comparison
Immigrants from Fiji
Peruvians
12.1%
RECEIVING FOOD STAMPS
27.8/ 100
METRIC RATING
193rd/ 347
METRIC RANK
11.7%
RECEIVING FOOD STAMPS
49.3/ 100
METRIC RATING
176th/ 347
METRIC RANK
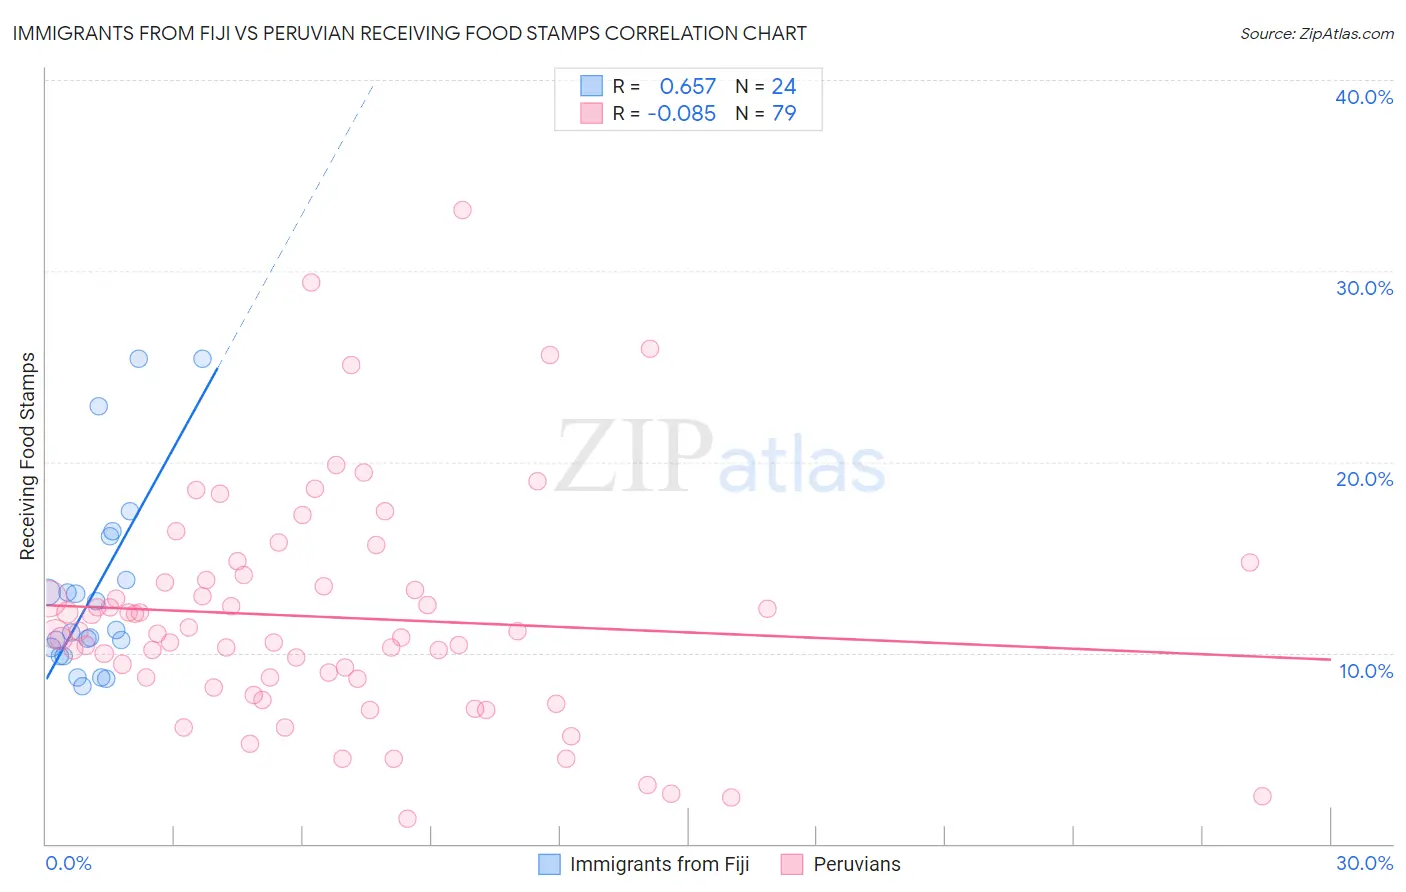
Immigrants from Fiji vs Peruvian Receiving Food Stamps Correlation Chart
The statistical analysis conducted on geographies consisting of 93,752,896 people shows a significant positive correlation between the proportion of Immigrants from Fiji and percentage of population receiving government assistance and/or food stamps in the United States with a correlation coefficient (R) of 0.657 and weighted average of 12.1%. Similarly, the statistical analysis conducted on geographies consisting of 362,284,397 people shows a slight negative correlation between the proportion of Peruvians and percentage of population receiving government assistance and/or food stamps in the United States with a correlation coefficient (R) of -0.085 and weighted average of 11.7%, a difference of 3.3%.
Receiving Food Stamps Correlation Summary
| Measurement | Immigrants from Fiji | Peruvian |
| Minimum | 8.3% | 1.3% |
| Maximum | 25.4% | 33.2% |
| Range | 17.2% | 31.9% |
| Mean | 13.3% | 11.9% |
| Median | 11.1% | 11.0% |
| Interquartile 25% (IQ1) | 10.0% | 8.7% |
| Interquartile 75% (IQ3) | 14.9% | 13.8% |
| Interquartile Range (IQR) | 4.9% | 5.1% |
| Standard Deviation (Sample) | 5.0% | 6.0% |
| Standard Deviation (Population) | 4.9% | 5.9% |
Demographics Similar to Immigrants from Fiji and Peruvians by Receiving Food Stamps
In terms of receiving food stamps, the demographic groups most similar to Immigrants from Fiji are Immigrants from Sudan (12.1%, a difference of 0.12%), Samoan (12.1%, a difference of 0.53%), Immigrants from Peru (12.0%, a difference of 0.71%), Venezuelan (12.0%, a difference of 0.71%), and Immigrants from Cameroon (12.0%, a difference of 0.77%). Similarly, the demographic groups most similar to Peruvians are Osage (11.7%, a difference of 0.070%), Immigrants from Eritrea (11.7%, a difference of 0.10%), Immigrants from Ukraine (11.8%, a difference of 0.13%), German Russian (11.8%, a difference of 0.17%), and Immigrants from Kenya (11.8%, a difference of 0.41%).
| Demographics | Rating | Rank | Receiving Food Stamps |
| Immigrants | Eritrea | 50.0 /100 | #174 | Average 11.7% |
| Osage | 49.8 /100 | #175 | Average 11.7% |
| Peruvians | 49.3 /100 | #176 | Average 11.7% |
| Immigrants | Ukraine | 48.4 /100 | #177 | Average 11.8% |
| German Russians | 48.1 /100 | #178 | Average 11.8% |
| Immigrants | Kenya | 46.4 /100 | #179 | Average 11.8% |
| Uruguayans | 44.8 /100 | #180 | Average 11.8% |
| South American Indians | 41.7 /100 | #181 | Average 11.9% |
| Immigrants | Morocco | 40.7 /100 | #182 | Average 11.9% |
| Immigrants | Uganda | 40.3 /100 | #183 | Average 11.9% |
| Spaniards | 39.8 /100 | #184 | Fair 11.9% |
| Immigrants | Iraq | 37.1 /100 | #185 | Fair 12.0% |
| Spanish | 36.9 /100 | #186 | Fair 12.0% |
| Albanians | 35.4 /100 | #187 | Fair 12.0% |
| Sudanese | 33.4 /100 | #188 | Fair 12.0% |
| Immigrants | Cameroon | 32.5 /100 | #189 | Fair 12.0% |
| Immigrants | Peru | 32.2 /100 | #190 | Fair 12.0% |
| Venezuelans | 32.1 /100 | #191 | Fair 12.0% |
| Samoans | 31.0 /100 | #192 | Fair 12.1% |
| Immigrants | Fiji | 27.8 /100 | #193 | Fair 12.1% |
| Immigrants | Sudan | 27.1 /100 | #194 | Fair 12.1% |